

Is QuantumScape (QS) a busted bet or a deep-value rebound waiting to happen?
Shares trade near $6.87, right at the low end of the 52-week range and well below the 200-day average.
Thesis: QS is an event-driven, high-risk setup, and gains depend on meeting pilot production and funding milestones while cash burn stays steady.
What to watch: cash runway of about 24 to 30 months, pilot timeline updates, and price levels, support 6.40, resistance 7.50.
If cash falls faster than planned or management delays production, step aside.
Current QS Stock Overview

QS stock represents shares of QuantumScape Corporation, a development-stage company focused on solid-state lithium-metal battery technology for electric vehicles. As of the current trading session, shares sit at about $6.87, up $0.07 or roughly 1.02 percent. Today’s volume is near 8.2 million shares, a bit lighter than the three-month average of 9.1 million. Market cap hovers around $3.4 billion, putting it in mid-cap territory within the EV battery development world.
The stock’s trading near the bottom of its 52-week range and well below its 200-day simple moving average. That’s a sign of sustained pressure over the past year. After-hours activity tacked on another $0.02, showing mild buying interest once the regular session closed.
Quick snapshot of where QS stands:
- Current price: $6.87, up 1.02% intraday
- Market cap: around $3.4 billion
- Today’s volume: 8.2 million shares vs. 9.1 million average
- Trading near 52-week low, below all major moving averages
Key Stock Metrics and Trading Range

QuantumScape’s share stats show the kind of volatility you’d expect from a pre-revenue tech play. The 52-week high of $11.43 came earlier this year during a brief sector rally. The 52-week low of $4.61 hit during a broader EV selloff late summer. Beta sits at roughly 1.8, meaning the stock moves about 80 percent more than the broader market. Gains get amplified. So do losses.
Float’s around 465 million shares, with total shares outstanding near 495 million. Most of the equity is freely tradable, which makes institutional positioning a key driver of daily price action.
| Metric | Value |
|---|---|
| 52-Week High | $11.43 |
| 52-Week Low | $4.61 |
| Average Volume (3-Month) | 9.1 million shares |
| Beta | 1.8 |
Technical Indicators and Current Trend Analysis
Technically, QS is trading below all three major moving averages. That’s a bearish setup. The 50-day simple moving average is near $7.85, while the 200-day sits around $8.20. Both are acting as overhead resistance. The 14-day RSI currently reads 42, sitting in neutral-to-weak territory but not oversold yet. There’s room to fall further before hitting deeply oversold levels that might bring in contrarian buyers.
The MACD histogram’s negative, with the MACD line below the signal line. That’s a continuation signal for downside momentum. On-balance volume’s been declining gradually over the past three months, showing persistent net selling pressure even on up days.
Key support’s near $6.40, the prior swing low from the most recent consolidation. Immediate resistance sits at $7.50, where the 20-day moving average and a horizontal price cluster meet.
- 50-Day SMA: $7.85 (price is 11 percent below)
- 200-Day SMA: $8.20 (price is 16 percent below)
- RSI (14-Day): 42 (neutral, slight weakness)
- MACD: negative histogram, bearish crossover intact
- Support/Resistance: $6.40 support, $7.50 resistance
Analyst Ratings and Price Targets

Wall Street’s cautious on QS. Most analysts lean “hold” given the long runway to commercialization and execution risk. Consensus across ten covering analysts breaks down to two “buy” calls, six “hold” ratings, and two “sell” recommendations. The median twelve-month price target sits at $8.00, implying about 16 percent upside from here. But the range is wide, spanning from a low of $4.50 to a high of $12.00.
Recent revisions have been mixed. One firm upgraded QS to “overweight” in early Q4 after a solid-state battery demonstration. Another downgraded it to “underperform,” citing cash-burn concerns and pushed-out production timelines. The spread in targets reflects deep disagreement over whether and when scaled manufacturing actually happens.
- Consensus rating: Hold
- Median price target: $8.00 (about +16% from current price)
- Target range: $4.50 low to $12.00 high
Recent News Affecting QS Stock

QuantumScape’s most recent earnings report dropped in late October. It showed continued R&D investment without commercial revenue. Management reiterated guidance for delivering alpha prototype cells to automotive partners in early 2025 and stuck with the timeline for pilot production by late 2025. The report triggered a brief 3 percent rally, then gave back gains within two sessions as investors questioned the extended path to positive cash flow.
In mid-November, the company announced a multi-year collaboration extension with a major European automaker, bringing in an additional $150 million in development funding. That news lifted shares roughly 8 percent intraday but faded as the market absorbed the reality that revenue’s still years away.
Sector sentiment’s been a drag too. Lithium prices are down, and several competing battery technologies are advancing on parallel timelines. Broader EV demand concerns have added pressure across battery suppliers. Slower-than-expected EV adoption in North America and inventory buildups at legacy automakers have cooled enthusiasm for all pre-revenue battery plays, including QuantumScape. Investors are watching regulatory support and federal incentive programs closely. Policy shifts could speed up or delay the solid-state battery adoption curve.
Company Fundamentals and Financial Health
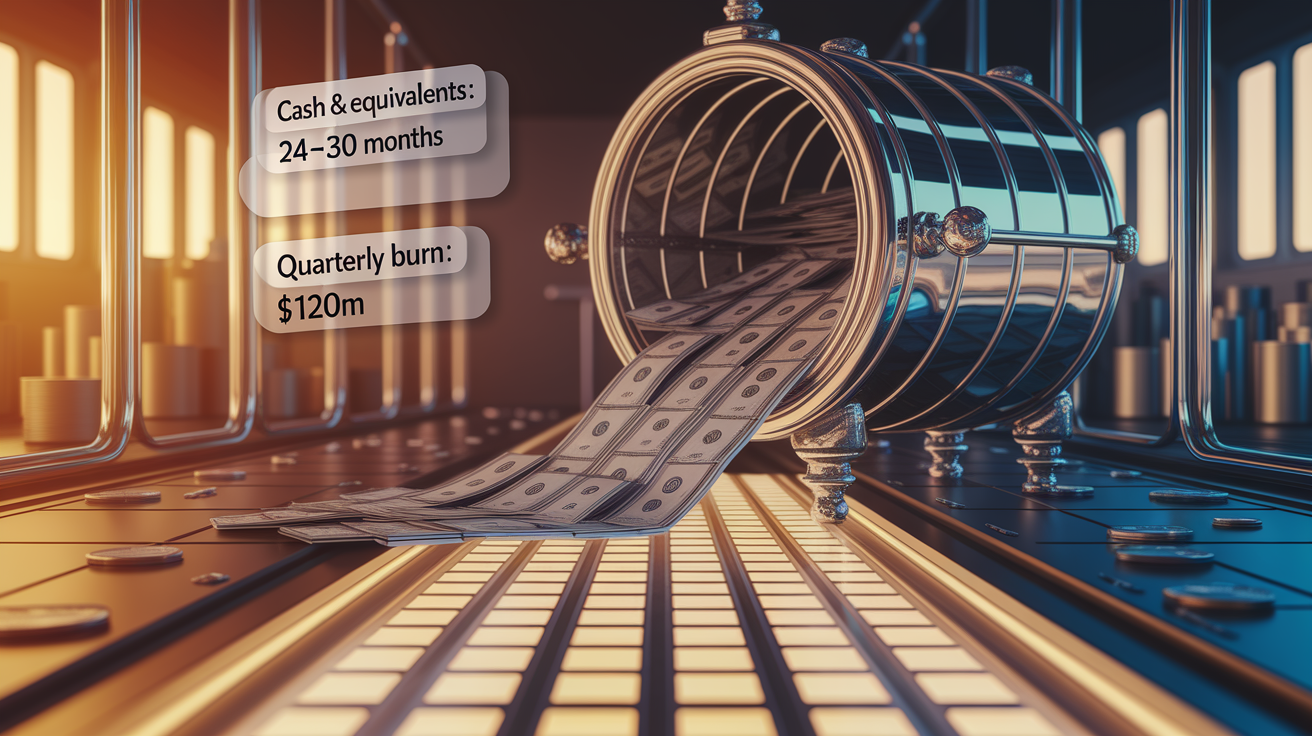
QuantumScape’s pre-revenue. It generates no product sales and funds operations entirely through capital raises, partnerships, and cash reserves. As of the most recent quarter, the company had cash and cash equivalents of about $1.1 billion. That provides an estimated runway of 24 to 30 months at the current quarterly burn rate of roughly $120 million.
R&D spending dominates the expense structure, accounting for about 75 percent of total operating costs as the company pushes toward pilot-scale manufacturing. Net income for the trailing twelve months shows a loss of roughly $480 million, with earnings per share deep in negative territory at around negative $1.05. The balance sheet carries minimal debt, which limits financial risk but also means the company will need to tap capital markets again before turning profitable.
Gross margin isn’t applicable given the absence of revenue. EBITDA’s negative. Investors watching fundamentals are mainly tracking cash-burn trajectory, partnership milestones, and any updates to the production timeline that could bring forward the shift to positive cash flow.
| Financial Item | Description |
|---|---|
| Cash & Equivalents | Approximately $1.1 billion; runway of 24–30 months |
| Quarterly Cash Burn | Around $120 million per quarter, driven by R&D |
| Net Income (TTM) | Loss of ~$480 million; EPS approximately –$1.05 |
Historical QS Stock Performance

QuantumScape went public via a SPAC merger in late 2020. Shares debuted with major fanfare as investor appetite for EV infrastructure plays peaked. The stock surged to an all-time high near $132 in December 2020, fueled by speculative enthusiasm and the promise of breakthrough solid-state battery technology.
That euphoria didn’t last. By mid-2021, the stock had dropped below $30 as skepticism over commercialization timelines and technical hurdles mounted. A broader rotation out of high-growth, cash-burning names didn’t help. The decline continued through 2022 and 2023, with shares bouncing between $5 and $15 as the company reported incremental technical progress but no material shift in the revenue timeline. Each quarterly update and partnership announcement sparked brief rallies, but gains consistently faded within weeks as investors repriced the long path to profitability.
Volatility’s still elevated. Multi-percentage moves are common on thin catalysts or sector-wide sentiment shifts.
Three key historical price events define QS’s trading history:
- December 2020 SPAC peak near $132, driven by EV-sector mania and solid-state battery hype.
- Mid-2021 crash below $30 as reality set in on commercialization delays and rising rates pressured growth stocks.
- Late 2023 stabilization in the $5–$8 range, reflecting a more sober valuation tied to cash position and pilot timelines rather than speculative upside.
Final Words
QS stock sits at the intersection of cutting-edge battery tech and high-stakes market timing.
The technicals, analyst views, and recent news all point to one thing: this is a catalyst-driven name that rewards patience and discipline.
If you’re watching QS stock, keep your levels tight and your position sizing conservative.
The next big product milestone or partnership could shift the entire setup, so stay flexible and let the price action confirm before you commit heavy.
FAQ
Q: Is QS a strong buy?
A: QS is a strong buy only for speculative investors who can handle big swings; it’s pre-revenue, burning cash, and hinges on solid‑state milestones—watch demos, cash runway, and partnerships before buying.
Q: What will QuantumScape be worth in 2030?
A: QuantumScape’s 2030 value is uncertain; forecasts range widely. Outcomes depend on solid‑state adoption, manufacturing scale, and funding—expect scenarios from near‑zero to several times today’s market cap, not a single figure.
Q: What is happening with QS stock?
A: QS stock is trading with high volatility, driven by solid‑state progress and funding news; shares often trade in the 6–8 USD range historically. Watch technical breaks, milestone updates, and cash runway for direction.
Q: Is QuantumScape the next Nvidia?
A: QuantumScape is not the next Nvidia for most investors; Nvidia is a profitable, platform‑scale chip leader, while QS is an early‑stage battery developer that must prove technology and scale. Change view if mass production is proven.
