Think restaurants stop buying food in a recession? Think again.
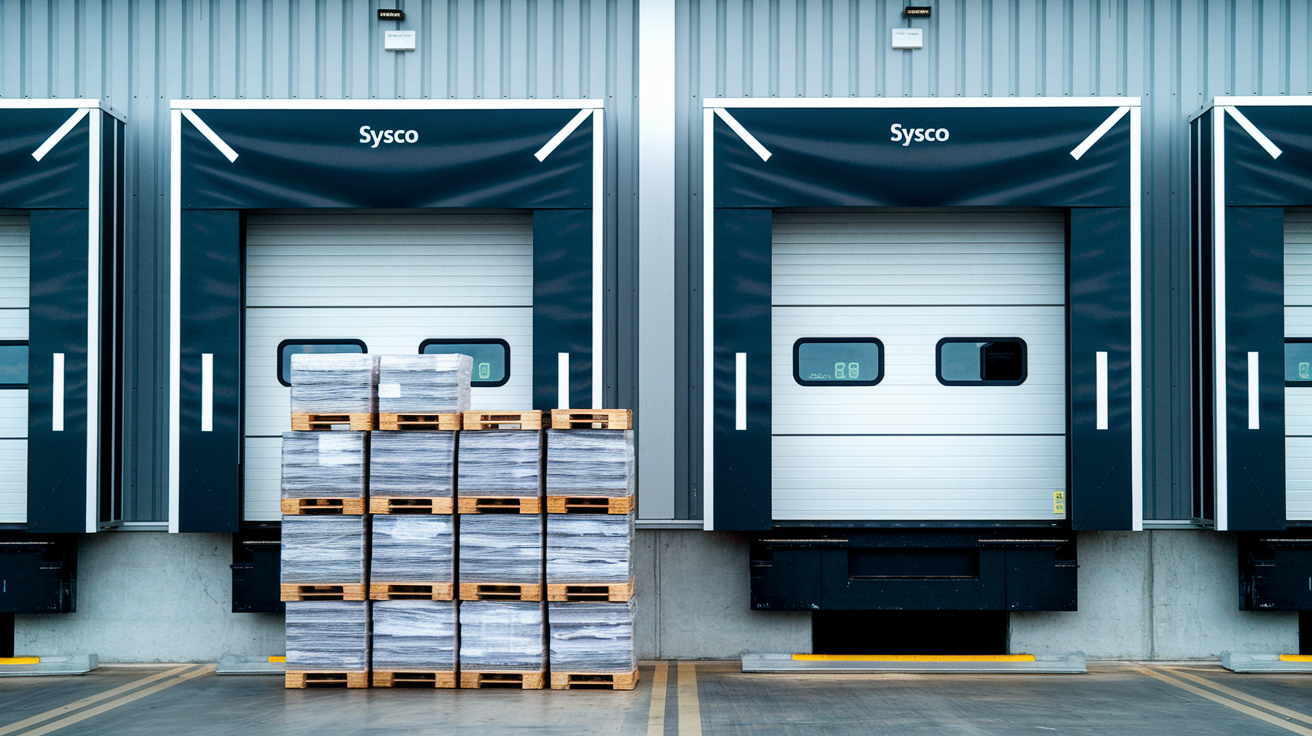
Sysco (SYY) sits between farms and kitchens, so people still need its deliveries even when spending tightens.
That scale, institutional customers, and pricing power give it a revenue floor that makes the stock more resilient than leisure or luxury names.
So if you want lower-volatility income, SYY belongs on the watchlist.
Watch quarterly free cash flow and institutional orders; if those slip, step back.
Yes, it falls in big recessions. It’s resilient, not bulletproof.
Core Assessment of Sysco’s Recession Resilience

Sysco Corporation runs the largest foodservice distribution network in North America. It delivers meat, produce, frozen goods, and dry ingredients to restaurants, healthcare facilities, schools, hotels, and convenience stores. That positioning in the food supply chain gives SYY semi‑defensive characteristics. People still need to eat when the economy contracts, and Sysco sits between farms and kitchens. Analysts often slot it alongside staples rather than pure cyclicals. The company’s scale and diversified customer base provide a revenue floor even when dining out drops, which makes it worth watching if you’re hunting for lower volatility during downturns.
Historical patterns show Sysco’s stock does fall in recessions. Drawdowns and recovery paths differ from highly cyclical sectors. During the 2008–2009 financial crisis, shares fell sharply with the broader market. The company kept operations running and maintained dividends, but it took several years to return to pre‑crisis levels as restaurant demand normalized. In the March 2020 pandemic selloff, Sysco dropped roughly 40–50 percent peak to trough when lockdowns shuttered on‑premise dining. The rebound started within months as healthcare and off‑premise channels strengthened. The stock returned toward pre‑COVID levels over the following year. These episodes show that Sysco shares aren’t immune to bear markets, yet the business model prevents the total earnings collapse you see in airlines or luxury retail.
Five structural drivers support Sysco’s recession resilience:
National scale and purchasing power lower per‑unit costs and enable volume leverage with suppliers, protecting gross margins when demand softens.
Diversified customer mix across restaurants, healthcare, education, government, and lodging spreads risk and limits exposure to any single end‑market downturn.
Pricing pass‑through capability allows Sysco to reprice contracts and adjust promotional programs, mitigating commodity and freight inflation over time.
Extensive cold‑chain logistics network creates switching costs for customers who depend on reliable delivery schedules and quality assurance.
Institutional demand floor from hospitals, schools, and senior‑living facilities provides sticky, less‑discretionary revenue streams that cushion total volumes.
Sysco qualifies as relatively resilient. Not recession‑proof. Foodservice demand is tied to consumer discretionary spending and business travel, so deep downturns compress revenue and margins. The stock reflects this cyclicality. It holds up better than leisure and hospitality equities but still tracks the broader economy. Investors treating SYY as a pure defensive play may be disappointed during severe contractions. Those viewing it as a lower‑volatility distribution leader with income upside will find the historical record more aligned with expectations.
Business Model Elements Supporting Sysco’s Stock Stability

Sysco’s physical footprint is massive. Hundreds of distribution centers serving hundreds of thousands of customers generate economies of scale that smaller regional competitors can’t match. Volume purchasing reduces product costs. Route density lowers delivery expense per stop. The company also invests in proprietary technology platforms for order management and inventory optimization, spreading fixed IT costs across a huge revenue base. This scale advantage means unit economics remain viable even when total volumes decline by mid‑single digits. That’s a critical buffer when restaurant traffic falls during a recession.
Customer diversification acts as the second stabilizing pillar. Roughly 70–75 percent of Sysco’s sales flow to commercial restaurants and hospitality, which are cyclical. But the remaining 25–30 percent serves healthcare systems, K‑12 and university dining, government cafeterias, and corporate contract feeding. Hospitals continue ordering supplies regardless of GDP. Schools operate on annual budgets with multi‑year contracts. Senior‑living communities maintain predictable meal schedules. During the 2008–2009 downturn, these institutional channels held steady while casual dining contracted, cushioning the overall revenue decline and shortening the trough period.
Sysco’s pricing and product‑mix flexibility further supports margin stability. The company can adjust contract pricing monthly or quarterly, passing commodity inflation to customers with a lag of one to two quarters. It also offers a broad portfolio of proprietary brands and private‑label lines that carry higher margins than third‑party national brands. During downturns it can shift promotional focus to these higher‑margin SKUs. This combination of passthrough mechanisms and mix management prevents the extreme margin collapses that hit manufacturers with long‑term fixed contracts or retailers locked into promotional calendars.
Historical Patterns of Sysco Stock in Major Recessions

The 2008 financial crisis hit Sysco as consumer spending on dining out fell and corporate catering budgets were slashed. Revenue growth turned negative in several quarters. Operating margins compressed as fixed distribution and warehouse costs spread over lower volumes. Gross margins held relatively steady because commodity price deflation offset weaker pricing power, but operating leverage worked in reverse. Every percentage point of volume decline translated to larger percentage drops in operating income. The company preserved its dividend and avoided a credit downgrade. Yet earnings per share fell materially year‑over‑year during the trough.
Sysco’s stock performance mirrored the severity of the selloff but with slightly less amplitude than the S&P 500 in the steepest months of late 2008. Shares peaked in mid‑2008, declined through the first quarter of 2009, then began a multi‑year recovery that lagged the broader market’s sharp 2009–2010 rebound. Restaurant traffic remained weak for years after the recession officially ended, delaying full earnings recovery until 2012–2013. Investors who bought near the trough benefited from dividend reinvestment and eventual margin normalization. But the stock didn’t outperform growth equities during the strong bull phase that followed.
The COVID‑19 pandemic represented a different shock. Sudden closure of on‑premise dining created an immediate 40–50 percent revenue collapse in certain channels during the second quarter of calendar 2020. Sysco furloughed workers, drew down credit lines, and shifted sales efforts to grocery stores, meal‑kit providers, and healthcare systems. Gross margins remained broadly stable because the company quickly repriced and cut lower‑margin promotional spend. Operating margins fell due to underutilized capacity. The stock bottomed in March 2020, then recovered as states reopened and vaccination campaigns began.
Recovery from the pandemic trough occurred faster than after 2008 because the cause was policy‑driven lockdowns rather than structural demand weakness. By mid‑2021 restaurant volumes were climbing back toward 2019 levels. Sysco’s stock price returned to pre‑COVID ranges within 12–18 months. The speed of the rebound illustrated how quickly foodservice distribution can snap back when the underlying demand for meals away from home remains intact and regulatory constraints lift.
| Downturn | Stock Drawdown (%) | Recovery Timeline |
|---|---|---|
| 2008–2009 Financial Crisis | ~40–50% peak‑to‑trough | Multi‑year (2012–2013 to regain prior highs) |
| COVID‑19 Pandemic (2020) | ~40–50% peak‑to‑trough (March 2020) | 12–18 months to pre‑COVID levels |
Revenue, Margin, and Cash Flow Stability as Recession Indicators

Sysco’s revenue base is typically in the range of $60 billion to $90 billion annually. It exhibits modest volatility in normal economic cycles, with organic growth in the low‑ to mid‑single digits outside of acquisitions. During recessions, top‑line contraction can reach mid‑ to high‑single digits or worse if restaurant closures are widespread. Gross margins, which historically fall between the high‑teens and low‑20 percent range, tend to hold steadier than operating margins because Sysco reprices regularly and benefits from mix shifts toward higher‑margin institutional customers. Operating margins, usually in the 3–6 percent band, are more sensitive. Every dollar of lost revenue leaves fixed warehouse and logistics costs unabsorbed, compressing operating income faster than gross profit.
Operating cash flow provides a critical resilience measure. In stable years Sysco generates several billion dollars of operating cash flow annually, often in the range of $2 billion to $6 billion depending on working‑capital swings and capital‑expenditure timing. Free cash flow, operating cash flow minus capex, funds dividends and debt reduction. During severe downturns, working capital can become a headwind if receivables stretch or inventory builds. Lower EBITDA reduces absolute cash generation. Monitoring quarterly free cash flow trends reveals whether the company can sustain its dividend and meet debt maturities without tapping credit lines.
Investors tracking Sysco’s recession resilience should watch four margin and cash‑flow indicators:
Year‑over‑year revenue decline percentage across consecutive quarters signals the depth of demand contraction.
Gross margin basis‑point change shows whether pricing actions are keeping pace with commodity and freight costs.
Operating margin compression of more than 200 basis points year‑over‑year flags serious fixed‑cost absorption stress.
Free cash flow turning negative for multiple quarters raises red flags for dividend coverage and liquidity.
Margin compression and cash‑flow weakness feed directly into recession resilience because they determine dividend sustainability and balance‑sheet flexibility. If operating margins fall only modestly and free cash flow remains positive, Sysco can maintain dividends and avoid forced asset sales or equity raises. If both metrics deteriorate sharply, the company may cut dividends or increase leverage, eroding the defensive appeal that attracts income investors in the first place.
Dividend Reliability and Sysco’s Role in Income Strategies

Sysco has paid quarterly dividends for decades and targeted steady or modestly growing payouts through multiple economic cycles. The annualized dividend per share in recent years has typically ranged from roughly $1.80 to $2.20, translating to a yield in the 2.5–4 percent band depending on share price. This yield sits above the S&P 500 average and appeals to income‑focused portfolios seeking lower volatility and regular cash distributions. The company’s long dividend history signals management’s commitment to returning cash to shareholders even during downturns. That trait differentiates Sysco from pure growth distributors that prioritize reinvestment over payouts.
Dividend sustainability hinges on the payout ratio, dividends as a percentage of free cash flow or earnings. In normal years Sysco’s payout ratio remains moderate, leaving room to weather temporary earnings dips. During the 2008–2009 recession the company preserved its dividend despite lower earnings, leaning on its credit facilities to smooth cash flow. In early 2020, when the pandemic crushed restaurant volumes, Sysco maintained the dividend but faced heightened scrutiny as free cash flow turned negative for several quarters. The dividend survived because management prioritized liquidity, cut costs aggressively, and expected a relatively swift reopening. Prolonged downturns with multi‑year revenue declines would place greater pressure on the payout.
Investors evaluating dividend safety during a recession should monitor five indicators:
Free cash flow per share versus dividend per share each quarter to confirm coverage remains above 1.0x.
Payout ratio trends over trailing twelve months to detect deterioration before a formal cut.
Net debt / EBITDA ratio since rising leverage reduces cash available for dividends.
Management commentary on capital allocation in earnings calls for signals of dividend policy changes.
Credit‑rating actions by agencies, as downgrades often precede dividend reductions to preserve balance‑sheet strength.
Balance Sheet Strength and Debt‑Level Considerations

Sysco operates with meaningful leverage typical of asset‑heavy distribution businesses. Net debt, total debt minus cash, divided by trailing EBITDA has historically ranged from roughly 2.5 times to 4.0 times, depending on acquisition activity and working‑capital swings. This leverage is manageable in stable or growing earnings environments because predictable cash flow covers interest expense and scheduled maturities. During recessions, however, EBITDA can fall 10–20 percent or more, pushing the net‑debt‑to‑EBITDA ratio higher even if absolute debt remains flat. A ratio climbing above 4.0 times sustained over multiple quarters raises concerns about credit‑rating downgrades and covenant compliance.
Liquidity, cash on hand plus undrawn committed credit facilities, provides the cushion that allows Sysco to navigate temporary earnings shocks without forced deleveraging. The company typically maintains access to multi‑billion‑dollar revolving credit lines, which it can draw in a crisis to fund working capital, meet debt maturities, or preserve dividends. During the March 2020 selloff, Sysco drew on its credit facilities as a precaution, signaling to the market that it had ample liquidity to weather the uncertainty. As revenues recovered through 2021, the company repaid those draws and rebuilt cash balances, demonstrating the importance of pre‑arranged credit access before a downturn strikes.
Leverage sensitivity to revenue and margin compression is nonlinear. A 10 percent revenue decline with modest margin compression might lift net‑debt‑to‑EBITDA from 3.0x to 3.5x, still within investment‑grade comfort zones. A 20 percent revenue drop combined with 200‑basis‑point operating‑margin contraction could push the ratio toward 4.5x or higher, triggering credit‑rating reviews and limiting financial flexibility. Investors assessing recession resilience should stress‑test Sysco’s balance sheet using plausible downside scenarios. Mild recessions with single‑digit revenue declines versus severe shocks with double‑digit contractions. Evaluate whether liquidity and interest coverage remain adequate under each case.
Comparing Sysco’s Recession Resilience to Broader Market Benchmarks

Sysco’s stock typically exhibits moderate volatility. Higher than utilities or consumer staples giants, lower than discretionary retailers or industrial cyclicals. The company’s beta coefficient, which measures sensitivity to market moves, has historically hovered near or slightly below 1.0, meaning Sysco’s stock tends to move roughly in line with the S&P 500 on average. During sharp market selloffs, however, sector rotation can cause temporary divergence. In the steepest weeks of a downturn, investors often sell everything indiscriminately, and Sysco declines alongside the index. As panic subsides and investors hunt for income and stability, Sysco’s defensive attributes attract buying interest, sometimes producing relative outperformance in the recovery’s early months.
Relative performance versus other defensive sectors shows Sysco occupying a middle ground. Pure consumer staples, packaged‑food manufacturers and grocery chains, often hold up better in recessions because at‑home food consumption is truly non‑discretionary. Sysco’s exposure to restaurants introduces cyclicality, so it typically underperforms the staples sector during deep downturns. Conversely, Sysco outperforms leisure, travel, and luxury stocks that depend entirely on discretionary spending. The result is a stock that declines in bear markets but recovers faster than the most cyclical names once the economy stabilizes.
Recovery‑speed differences hinge on the nature of the recession. Demand‑driven recessions with prolonged unemployment and weak consumer confidence, like 2008–2009, produce slow, multi‑year recoveries for Sysco as restaurant traffic gradually returns. Short, sharp shocks driven by temporary disruptions, like the 2020 lockdowns, allow faster snapback once the constraint lifts. Investors comparing Sysco to the S&P 500 should consider the recession’s root cause: structural or transitory. Structural downturns favor indexes weighted toward secular‑growth tech. Transitory shocks favor defensive distributors that snap back quickly.
| Metric | Sysco | S&P 500 |
|---|---|---|
| Typical Beta (historical) | ~0.9–1.1 | 1.0 (by definition) |
| 2008–2009 Drawdown | ~40–50% | ~50–57% |
| COVID‑19 (2020) Drawdown | ~40–50% | ~34% |
Forward‑Looking Recession Risks and Scenario Analysis for Sysco Stock

Demand‑driven risks dominate Sysco’s recession vulnerability. Food‑away‑from‑home spending, dining at restaurants, hotels, and entertainment venues, falls sharply when consumers lose jobs, reduce discretionary budgets, or shift to cooking at home. In a typical recession, restaurant traffic can drop 5–15 percent. Corporate catering and event spending often falls further. Sysco’s revenue exposure to these channels means a prolonged downturn directly translates to volume declines, even if institutional customers remain stable. The elasticity of restaurant demand varies by segment. Quick‑service and fast‑casual tend to be more resilient than full‑service and fine dining. So the mix of Sysco’s customer base influences total impact.
Input‑cost inflation adds a second layer of risk. Sysco sources thousands of SKUs, from beef and seafood to cooking oil and paper products. Commodity prices can spike during supply shocks or currency moves. The company’s pricing model allows passthrough, but there’s typically a one‑ to two‑quarter lag between cost increases and contract repricing. If a recession coincides with commodity inflation, stagflation scenarios, Sysco faces margin compression as costs rise faster than revenue and customers resist price hikes amid weak demand. Conversely, deflationary recessions ease input costs and can support gross margins even as volumes fall.
Leverage and liquidity risks become acute if revenue declines persist beyond two or three quarters. Sysco’s existing debt load is manageable under normal EBITDA. But a 15–20 percent revenue drop combined with margin compression can push net‑debt‑to‑EBITDA ratios into uncomfortable territory and strain interest coverage. If free cash flow turns negative for multiple quarters, the company must either draw credit lines, cut dividends, or reduce capital expenditures and working capital. Credit‑rating agencies monitor these metrics closely. A downgrade raises borrowing costs and signals deteriorating financial health to equity investors.
Six recession warning indicators should sit on every Sysco investor’s monitoring dashboard:
Consecutive quarterly revenue declines exceeding 15 percent year‑over‑year, signaling severe demand contraction.
Operating margin compression greater than 200 basis points year‑over‑year, indicating inability to absorb fixed costs or pass through inflation.
Net‑debt‑to‑EBITDA ratio rising above 4.0 times on a sustained basis, flagging elevated leverage risk.
Free cash flow turning negative for two or more consecutive quarters, threatening dividend coverage and liquidity.
Dividend payout ratio exceeding 100 percent of free cash flow, a precursor to potential cuts.
Management guidance cuts or suspension, reflecting uncertainty about near‑term recovery.
A mild recession scenario, GDP contracting 1–2 percent, unemployment rising modestly, lasting two to three quarters, would likely produce single‑digit revenue declines for Sysco, limited margin compression, and stable‑to‑slightly‑higher leverage ratios. The dividend would remain covered by free cash flow. The stock might decline 15–25 percent before stabilizing as investors price in the trough. A severe recession scenario, GDP falling 3–5 percent or more, unemployment spiking, lasting four‑plus quarters, could drive double‑digit revenue drops, operating‑margin compression of 200–300 basis points, sharply higher leverage, and potential dividend reductions. In that case, the stock could fall 40–50 percent, matching or exceeding 2008 and 2020 drawdowns. Recovery would depend on the speed of restaurant reopenings and consumer‑spending normalization.
Final Words
In the action: Sysco’s role as the nation’s food distributor gives it semi-defensive traits, steady institutional demand, scale, and passthrough that help steady revenue even when restaurants pull back.
We saw the pattern in 2008 and 2020: meaningful drawdowns but faster recoveries than many pure cyclicals.
Watch revenue trends, free cash flow, leverage, and dividend health. Treat it as partial protection, not a shield.
If dining demand returns, SYY should recover. Keep sysco stock recession resilience in mind as you weigh risk and reward.
FAQ
Q: Should I sell Sysco stock?
A: The decision to sell Sysco stock (SYY) depends on your goals: hold for income and semi-defensive exposure; sell if revenue and margins weaken materially, dividend is cut, or net-debt/EBITDA rises above about 4.0x.
Q: What stocks recover fastest after a recession?
A: Stocks that recover fastest after a recession are high-quality growth and essentials: big tech (AAPL, MSFT), discount/grocery (WMT, COST), plus resilient healthcare names; watch earnings, consumer spending, and support levels before buying.
Q: Where will Costco be in 5 years?
A: Costco will likely be larger in five years with steady comp growth, stronger membership-driven cash flow, and expanded e-commerce; watch membership growth, same-store sales, and warehouse rollouts as key catalysts.
Q: What are the top three stocks to buy right now?
A: The top three stocks to buy right now are AAPL (growth), COST (defensive retail), and MSFT (enterprise cloud); size positions per risk, watch earnings, key support levels, and macro-driven consumer trends before buying.