
Think buying stocks near 52-week highs is just gambling?
It doesn’t have to be.
This screener pulls mid- and large-cap names trading near or at their 52-week high and adds the exact data you need to separate true momentum from hype.
We flag volume spikes, RSI (momentum reading), 50- and 200-day trend context, short interest and earnings so you can build a tight watchlist and plan entries.
So the thesis: use confirmed breakouts on heavy volume as your buy zone, watch a close above the high as confirmation, and step aside if volume fades or price drops back below support.
How the Screener Works

Every day, thousands of stocks trade across global exchanges, but only a handful push into new 52-week high territory. This screener surfaces those names in real time and hands you the data you need to decide whether a breakout deserves your capital.
The tool updates at market close each trading day. Prices, volume, technical indicators all refresh within minutes of the final bell. All price data reflects end-of-day settlement values, though intraday alerts are available for subscribers who need faster triggers.
The screener pulls from a universe of mid and large cap equities trading above three dollars per share with average daily dollar volume exceeding one million. That liquidity floor ensures you can enter and exit positions without slippage eating into your edge.
Each ticker in the results carries a full technical snapshot: current price, the 52-week high (both absolute and percentage distance), today’s volume, the 20-day average volume, RSI(14), the 50-day and 200-day simple moving averages, ATR(14) for volatility sizing, market cap, float, short interest as a percentage of float, sector classification, and beta.
Volume data matters as much as price. A stock that scratches a new high on thin volume often reverses within days. The screener calculates today’s volume as a multiple of the 50-day average. Anything above 1.5× flags potential conviction, and readings above 2.0× suggest institutional accumulation or a catalyst at work.
The RSI(14) reading tells you whether momentum is building or exhausted. Values between 60 and 70 signal strength without extreme overbought conditions. Readings above 80 warn that a near term pullback may arrive before the next leg higher.
Moving averages provide trend context. A stock trading above both its 50-day and 200-day moving averages operates in a defined uptrend. When the 50-day crosses above the 200-day, a “golden cross,” the longer term momentum picture turns bullish, and breakouts from that setup tend to hold longer.
ATR(14), or Average True Range over 14 days, measures daily price movement in dollar terms. If a stock has an ATR of 2.50, expect typical daily swings of about that amount. Use ATR to size stops intelligently. Placing a stop one ATR below your entry adapts to the stock’s natural volatility rather than imposing an arbitrary percentage.
The screener also surfaces corporate event flags: upcoming earnings dates, recent dividend announcements, ex-dividend dates, and any material news in the past 48 hours. Breakouts that coincide with earnings beats or guidance raises carry different risk profiles than technical only setups.
Sector classification lets you filter by industry group. On days when technology leads, you might focus breakouts in software or semiconductors. During defensive rotations, consumer staples and utilities breakouts deserve closer review.
Short interest data highlights potential short squeeze dynamics. When a stock with short interest above 15 percent breaks to a new high on volume, covering can accelerate the move. Conversely, a failed breakout in a heavily shorted name can reverse violently as fresh shorts pile in.
All data fields sort and filter with a single click. Want only stocks within half a percent of their 52-week high? Set the distance filter to 0.0–0.5 percent. Looking for confirmed breakouts on heavy volume? Filter for “close above 52-week high” and “volume ratio ≥ 1.5×.” The interface remembers your last filter preset so your daily workflow stays fast.
The system flags gap opens exceeding two percent. A gap up open that holds through the session often confirms strong overnight interest, while gaps that fill by midday suggest early profit taking and weaker hands.
Charts load inline beside each ticker. One click opens a candlestick view with volume bars, the 52-week high marked as a horizontal line, RSI(14) in the lower panel, and 50-day and 200-day moving averages overlaid on price. The breakout candle, if one occurred today, appears highlighted in green, and the chart auto scales to show the past three months of action so you can assess the base and consolidation pattern that preceded the move.
You can export the full result set as CSV or Excel at any time. The export includes every column and any filters you applied, so you can archive daily snapshots, run your own backtests, or feed the data into a portfolio tracker.
Real time alerts tie into the screener for users who enable notifications. Set an alert for “ticker within 1 percent of 52-week high” or “close above 52-week high on volume > 2× average,” and you’ll receive an email or SMS within seconds of the trigger. Webhooks are available for integration with trading platforms or custom bots.
The screener doesn’t recommend securities. It surfaces data and flags conditions that historically precede momentum moves. Every decision remains yours, and every position carries risk. The tool’s job is speed and clarity, putting the right numbers in front of you so you can act or pass with confidence.
Pre-Built Filters and Presets

The screener ships with 13 preset filters designed to match common breakout strategies. Each preset applies a different combination of price, volume, and technical thresholds so you can jump straight to the setups that fit your playbook.
Near Breakout shows stocks trading within two percent below their 52-week high. These are the watch list candidates, names building toward a break but not yet confirmed. Use this preset to build alerts and prepare entry orders for the next session.
Breakout with High Volume returns only stocks that closed above their 52-week high today with volume at least 1.5 times the 50-day average. This filter isolates the highest conviction breakouts and removes low volume noise. The breakout happened, and someone showed up to buy it.
Volume Breakout drops the price requirement and surfaces any ticker where today’s volume exceeded twice the 50-day average, regardless of proximity to the 52-week high. This preset catches early stage accumulation and pre-breakout surges that may lead the price higher in coming sessions.
15-Minute Breakout tracks intraday price action and flags stocks that breached their 52-week high within any 15-minute bar during the session, even if the daily close finished below that level. Day traders use this preset to catch intraday momentum and scalp quick moves.
Weekly Breakout applies the same logic on a weekly timeframe. A stock must close the week above its 52-week high (calculated on weekly bars) with weekly volume above the 10-week average. Swing traders prefer this filter because weekly breakouts tend to produce longer lasting trends.
Monthly Breakout flags stocks that finished the month above their 52-week high, measured on monthly candlesticks. This preset is less noisy and suits position traders willing to hold through multi-week consolidations.
Price-Volume Breakout combines two conditions: close above 52-week high and volume at least 2.0 times the 50-day average. This stricter threshold reduces false signals and highlights only the most explosive setups.
All-Time High Breakout goes beyond the 52-week window and returns stocks that hit a new all-time high today. These are the ultimate momentum names, no historical resistance overhead. The risk is that valuation may stretch, but the reward is that all-time-high breakouts often run for weeks without a meaningful pullback.
200 EMA Breakout filters for stocks that closed above their 200-day exponential moving average for the first time in at least 30 days. This preset catches longer term trend reversals and suits investors looking to ride a multi-month recovery or expansion phase.
200 DMA Breakout applies the same concept using the 200-day simple moving average instead of the exponential version. The simple moving average weighs all 200 days equally, so it reacts more slowly to recent price changes and produces fewer false crosses.
50 DMA Breakout looks for stocks that moved above their 50-day moving average today after spending at least five sessions below it. This shorter term filter highlights stocks exiting consolidation or bottoming after a brief correction.
You can layer additional filters on top of any preset. Add a minimum market cap of 500 million, a maximum beta of 1.5, or a sector restriction to technology and healthcare. The system applies filters in sequence and updates the result count in real time.
Each preset saves automatically once you apply it. Return tomorrow and click “Breakout with High Volume” to see today’s updated list without re-entering thresholds. Set it once, use it every day.
Custom presets let you save your own combinations. If you trade only large cap biotech stocks that break on volume above three times average and RSI between 60 and 75, build that filter once, name it, and load it with one click going forward.
Presets are date stamped, so you can review which setups triggered on any prior session. Historical preset results let you backtest ideas and refine thresholds before committing real capital.
Technical Snapshot Per Ticker

When you click any ticker in the screener results, a detailed panel expands with the full technical and fundamental profile. This snapshot is where you decide whether the breakout setup is worth a trade or just noise.
The top line shows the company name, ticker symbol, sector, and a one sentence business description. Below that, the current price appears in large type alongside the day’s absolute and percentage change. If the stock gapped open, the gap size displays in parentheses. “Opened +3.2% above prior close.”
The 52-week high field shows the exact intraday peak over the past 252 trading days, the date it occurred, and today’s closing distance to that level. Distance appears both in dollars and as a percentage. A stock trading at 49.80 with a 52-week high of 50.00 sits 0.20 dollars or 0.4 percent away.
Today’s volume and 50-day average volume appear side by side with the volume ratio calculated automatically. A reading of 2.1× tells you today’s turnover more than doubled the 50-day norm. Volume spikes without corresponding news often signal institutional buying or insider knowledge ahead of a public catalyst.
RSI(14) shows the 14-period Relative Strength Index. The indicator ranges from 0 to 100. Values above 70 traditionally flag overbought conditions, but in strong trends RSI can stay elevated for weeks. The screener highlights RSI readings above 80 in red and below 30 in green, though breakout traders care more about the 50–70 zone where momentum builds without exhaustion.
Moving averages list the 20-day, 50-day, and 200-day simple moving averages alongside each price level. The panel calculates how far the current price sits above or below each average. “Price is 6.2% above the 50-day SMA.” It flags golden crosses (50-day above 200-day) and death crosses (50-day below 200-day) when they occurred within the past 30 sessions.
ATR(14) expresses the Average True Range over the past 14 days in dollars. If ATR reads 1.85, the stock typically moves about that much per day. Multiply ATR by 1.5 and you get a reasonable initial stop distance: 1.85 × 1.5 = 2.78 dollars below entry.
Market capitalization, shares outstanding, and float define the stock’s size and liquidity. Float is the number of shares available for public trading, excluding insider and institutional lockups. A small float paired with high short interest creates squeeze potential but also increases downside risk if sentiment reverses.
Short interest appears as a percentage of float and as total shares short. Short interest above 15 percent flags potential squeeze setups. The panel also shows “days to cover,” which divides shares short by average daily volume. A reading above three days indicates it would take short sellers multiple sessions to fully exit, increasing the chance of a forced rally.
Beta measures the stock’s historical volatility relative to the broader market. A beta of 1.0 means the stock moves in line with the index. Above 1.5 signals higher volatility and requires wider stops and smaller position sizes.
Dividend yield and the most recent ex-dividend date appear if applicable. Breakouts in dividend payers sometimes stall into ex-dividend dates as buyers wait to collect the payout. Knowing the next ex-date helps time entries around short term selling pressure.
The panel pulls recent corporate events: last earnings date, next earnings date (if scheduled), and any material 8-K filings in the past 30 days. Breakouts that follow earnings beats or guidance raises carry fundamental support. Breakouts without a clear catalyst rely purely on technical momentum and mean reversion risk runs higher.
Institutional ownership breaks down into three buckets: promoter (insider), foreign institutional investors (FII), domestic institutional investors (DII), and public float. High FII and DII ownership suggests smart money accumulated shares before the breakout. A sharp increase in institutional holdings quarter over quarter confirms conviction.
Price to earnings ratio, price to book ratio, return on equity, and earnings per share provide fundamental context. Expensive valuations don’t invalidate breakouts, but they do narrow the margin for error. A stock trading at 50× earnings needs flawless execution to justify the multiple, while a 15× P/E breakout has more room to disappoint and still hold gains.
Revenue and earnings growth over the trailing twelve months appear with sector comparisons. If a company grew revenue 38 percent while its sector averaged 9 percent, the breakout likely reflects strong fundamentals rather than speculative froth. “Revenue up 37.57% YoY to Rs 2,811 Crores; sector average 8.79%.”
Finally, the snapshot shows chart pattern classification if the system detected a defined setup: cup and handle, ascending triangle, flat base, or high tight flag. Each pattern carries historical win rate data. Cup and handle formations, for example, succeed roughly 80 percent of the time when confirmed on volume above 1.5× average.
All data fields update at market close. Subscribers with real time access see intraday updates every 15 minutes during market hours, so the snapshot reflects live conditions for day trading decisions.
Visuals: Charts and Breakout Annotations

The inline chart is where the story of the breakout becomes visible. Price action alone tells you what happened. The chart shows you how it happened and whether the setup is likely to follow through.
Every chart defaults to a three month daily candlestick view. Three months captures the consolidation base that precedes most breakouts without cluttering the screen with excessive history. One click zoom buttons let you expand to six months, one year, or five years if you need more context.
The 52-week high appears as a bold horizontal line across the chart. When price approaches that line from below, you see the compression and coiling that often precedes a breakout. When price crosses above the line and closes there, the breakout candle is highlighted in green with a small annotation: “Breakout: [date], Volume [X]× avg.”
Volume bars sit below the price panel. A red dotted line marks the 50-day average volume so you can instantly see whether today’s bar is above or below the norm. Breakout candles with volume bars extending well above the average line confirm conviction. Volume was there when it mattered.
The RSI(14) panel appears directly beneath volume. RSI is plotted as a line oscillating between 0 and 100, with horizontal reference lines at 30, 50, and 70. When RSI crosses above 50 as price breaks out, momentum is building. When RSI already sits above 70, the move may be late stage, and a pullback becomes more likely before the next leg higher.
Moving averages overlay the price panel. The 50-day SMA appears as a blue line, and the 200-day SMA as a red line. When both lines slope upward and price sits above both, the trend is unambiguously bullish. When the 50-day crosses above the 200-day, the chart flags the golden cross with a small icon and date.
Measured move targets are drawn automatically when the system detects a defined consolidation base. The tool measures the height of the base from low to high, then projects that distance upward from the breakout point. For example, if a stock consolidated between 40 and 50 for three months, the base height is 10 dollars. A breakout at 50 targets 60. The target appears as a dotted horizontal line above the breakout candle.
Support and resistance zones are shaded in light gray. The system identifies prior swing highs and consolidation lows over the past six months and marks them as potential inflection points. If a stock breaks out, then pulls back to the old 52-week high, that level often acts as support. The chart shades that zone to remind you where buyers may step in again.
Gap opens are marked with a small arrow. A gap up above two percent triggers a green arrow. A gap down below negative two percent triggers a red arrow. Gaps that fill intraday are crossed out with a thin line, signaling early weakness. Gaps that hold through the close remain highlighted, indicating sustained buying or selling pressure.
Annotations include brief notes for key events: earnings releases, dividend ex-dates, analyst upgrades, FDA approvals, product launches, or merger news. These labels sit just above the relevant candle so you can connect price action to the catalyst.
The chart also overlays ATR based stop levels. If you enter a breakout trade, the system calculates a stop 1.5× ATR below your entry and draws it as a thin red line. As the stock moves higher, you can manually drag the stop line upward to lock in gains. The chart recalculates your reward to risk ratio in real time.
Pattern detection overlays highlight classic technical formations: cup and handle, ascending triangle, bull flag, or flat base. When a pattern is detected, the system outlines the formation with a light blue border and adds a small label with the pattern name and historical success rate. “Cup & Handle, 80% historical win rate on volume confirmation.”
You can toggle between timeframes without leaving the page. Click “1M” to see one month of hourly bars. Click “5D” to see five days of 15-minute bars. Intraday views are useful for refining entry timing, waiting for a pullback to the breakout level during the first hour, for example, rather than chasing at the open.
The chart auto updates every 15 minutes during market hours if you’re logged in with real time access. After hours, the chart freezes at the 4:00 PM close and refreshes again at the next open.
All charts export as PNG images. Right click any chart and select “Download” to save a snapshot for your trade journal or watchlist review.
Breakout Trading Strategies: Entry, Confirmation, and Exits
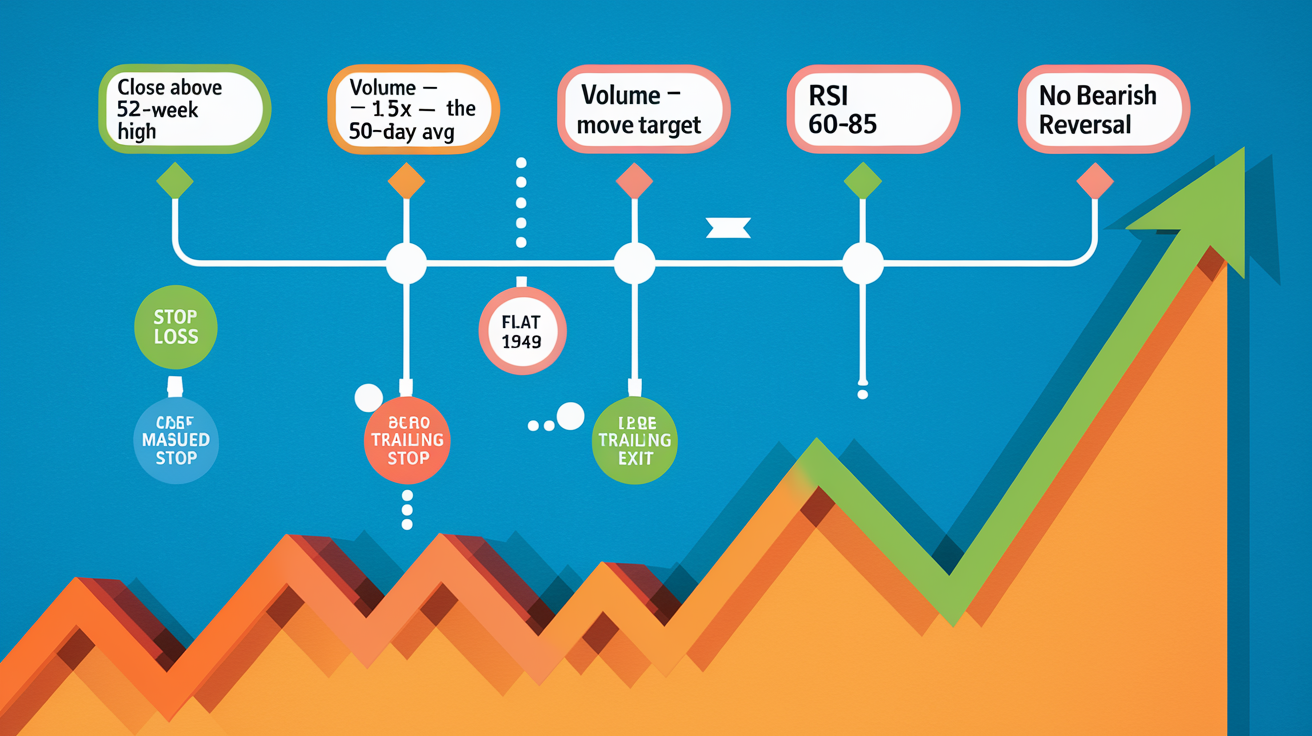
A breakout above the 52-week high is a signal, not a guarantee. The strategy you wrap around that signal determines whether you capture the move or get chopped up by a false start.
Entry timing matters. The simplest entry is buying on the daily close above the 52-week high. You wait for the 4:00 PM bell, confirm the close is above the prior high, and enter in after hours or at the next morning’s open. This approach avoids intraday fakeouts and ensures the breakout held through the full session.
A more patient entry waits for the first pullback. Many breakouts retrace to the breakout level within three to ten trading days. If the stock breaks out at 50, rallies to 52, then pulls back to 50.50, that’s your entry. You get in closer to support with a tighter stop and better reward to risk.
The pullback entry requires discipline. Set an alert for “price within 1.5 percent of breakout level” and wait. If the stock never pulls back and runs straight to your measured move target, you miss it. That’s fine. Chasing a runaway breakout is how traders turn winners into losers.
Confirmation thresholds reduce false signals. A clean breakout meets these conditions: close above 52-week high, volume at least 1.5× the 50-day average, RSI above 60 but below 85, and no bearish reversal candle (long upper wick, close near the low). If volume is weak or RSI is already extreme, wait another day or skip the setup.
Position sizing ties directly to stop placement. Decide your maximum loss per trade, typically one percent of portfolio equity. If you’re trading a $100,000 account and risk $1,000 per trade, and your stop is five percent below entry, you can buy $20,000 worth of stock (400 shares at $50 with a $2.50 stop gives $1,000 total risk).
ATR based stops adapt to volatility. A stock with ATR of 1.80 might justify a stop 1.5× ATR below entry, or 2.70 dollars. A stock with ATR of 0.60 needs a tighter stop of perhaps 0.90 dollars. The key is giving the stock room to breathe without risking more capital than your system allows.
Percentage based stops are simpler but less adaptive. A flat five percent stop works across many setups, but in high volatility names you’ll get stopped out on normal noise, and in low volatility names you risk more than necessary.
Profit targets come in two flavors: fixed and trailing. Fixed targets use the measured move method, project the height of the consolidation base above the breakout point. If the base was 10 dollars tall, target 10 dollars of upside from the breakout. Take half your position off at that level and trail a stop on the remainder.
A 2:1 reward to risk target is a reliable baseline. If you risk $2.50, target $5.00 of profit. Many traders take partial profits at 1:1 ($2.50 gain), move the stop to breakeven, and let the rest run toward 3:1.
Trailing stops lock in gains as the trade moves in your favor. A common rule: once you’re up three percent, move your stop to breakeven. Once you’re up ten percent, trail the stop at the 20-day moving average or 1.5× ATR below the current price. This keeps you in the trade during normal pullbacks but exits before a larger correction erases your gains.
Time based exits add a secondary risk control. If a breakout hasn’t reached your profit target within 20 trading days and price is drifting sideways, close the position. Dead money ties up capital and creates opportunity cost. You could be in a fresher setup instead.
Stop loss discipline is non negotiable. If price closes below your stop level, exit the next morning at the open or, if using a stop market order, let the system execute automatically. Never widen a stop after entry. That single rule prevents small losses from becoming large losses.
Failed breakouts happen. A stock breaks out, volume is strong, and two days later it’s back below the 52-week high. Your stop takes you out with a small loss, and that’s the system working. The goal isn’t to win every trade. It’s to keep losses small and let winners run until the trend breaks.
Scaling in is an advanced technique. Instead of buying your full position at the breakout, take half. If the stock confirms by holding above the breakout level for three days and making a higher high, add the second half. This reduces risk if the breakout fails immediately but costs you some upside if the stock gaps and runs.
Avoid breakout traps. Low float stocks with high short interest can spike on a squeeze, then collapse within hours. News driven breakouts, FDA approvals, earnings surprises, often gap at the open and reverse by lunch as early buyers take profits. Volume is the filter: if the breakout volume is under 1.5× average or if the stock has a history of false breakouts, pass.
Risk Management and Position Sizing Examples

Risk management is the difference between a breakout strategy that compounds capital and one that bleeds through volatility. The math is simple, but execution under pressure isn’t.
Start with a portfolio level rule: never risk more than one percent of your account on any single trade. If you manage $100,000, your maximum loss per trade is $1,000. This ensures that even a string of five or ten losses in a row won’t impair your ability to continue trading.
Position size formula:
Shares to buy = (Portfolio × Risk %) / (Entry Price, Stop Price)
Example one: $100,000 portfolio, one percent risk ($1,000), entry at $50.00, stop at $47.50.
Distance to stop = $50.00, $47.50 = $2.50
Shares = $1,000 / $2.50 = 400 shares
Position cost = 400 × $50.00 = $20,000 (20 percent of portfolio)
This position size risks exactly $1,000 if the stop is hit, and uses 20 percent of your capital. The position percentage varies with stop distance. A tighter stop lets you buy more shares and deploy more capital while keeping dollar risk constant.
Example two: $100,000 portfolio, one percent risk ($1,000), entry at $50.00, stop at $46.00 (wider stop).
Distance to stop = $4.00
Shares = $1,000 / $4.00 = 250 shares
Position cost = 250 × $50.00 = $12,500 (12.5 percent of portfolio)
The wider stop forces a smaller share count to maintain the $1,000 risk limit. This is correct. Wider stops require smaller positions. Tighter stops allow larger positions.
ATR based stop example:
Stock: entry $50.00, ATR(14) = $1.80.
Stop distance = 1.5 × ATR = 1.5 × $1.80 = $2.70
Stop price = $50.00, $2.70 = $47.30
Shares = $1,000 / $2.70 = 370 shares
Position cost = 370 × $50.00 = $18,500
ATR stops adapt to the stock’s volatility. A calm stock with ATR of $0.80 would get a stop distance of $1.20 (1.5 × $0.80), allowing 833 shares ($1,000 / $1.20) and a position size of $41,650, larger because the stop is tighter.
Scaling position size by confidence:
Not every breakout deserves a full one percent risk. If volume is marginal or the setup has mixed signals, risk 0.5 percent ($500) instead. If the breakout follows a strong earnings beat, sits on a perfect cup and handle, and triggers on 3× volume, you might size up to 1.5 percent ($1,500), but never exceed two percent on any single trade.
Max exposure per sector:
Breakouts often cluster by sector. If technology is leading, half your watchlist might be tech stocks. Limit total risk to any one sector to three percent of your portfolio. If you already have two tech breakout trades running, pause before adding a third, even if the setup looks good.
Max number of concurrent positions:
Running ten breakout trades at once sounds diversified, but it spreads your focus and increases the chance that correlated positions all stop out on the same market downdraft. A practical limit is five to eight positions. Each gets enough capital to matter, and you can monitor all of them daily without missing exits.
Time decay and opportunity cost:
If a breakout trade hasn’t moved within ten sessions and you’re still near breakeven, consider closing it and redeploying capital into a fresher setup. Sitting in a flat trade for three weeks while five other breakouts run costs you more than the commissions to exit and re-enter.
Stop adjustments after profits:
Once a trade gains three percent, move your stop to breakeven (entry price). If the stock reverses, you exit with zero loss instead of a one percent hit. Once you’re up ten percent, trail your stop at the 20-day moving average or 1.5× ATR below the current high. Lock in at least half your gain but leave room for the trend to continue.
Profit taking schedule:
Many traders take partial profits at predefined levels to remove emotion from the decision. Example schedule for a breakout entry at $50 with a $47.50 stop and a measured move target of $60:
- At $52.50 (+5%, 1:1 reward to risk): sell 25% of position.
- At $55.00 (+10%, 2:1): sell another 25%.
- At $60.00 (target, 4:1): sell final 50%, or trail stop and hold if trend remains strong.
This approach guarantees you book profits along the way. Even if the stock reverses at $56, you’ve already locked in gains on half the position.
Portfolio heat:
Add up the dollar risk across all open trades. If you have five trades running, each risking $1,000, your portfolio heat is $5,000 (five percent of $100,000). If all five stop out simultaneously, rare but possible in a market crash, you lose five percent. Keep total portfolio heat below ten percent unless you’re an experienced trader willing to accept larger drawdowns.
Backtest Methodology and Historical Performance

Backtesting a breakout strategy requires clean data, consistent rules, and realistic assumptions about execution. The goal isn’t to find a perfect system but to understand win rates, average returns, and maximum drawdowns so you can size positions and set expectations accordingly.
Backtest parameters:
- Universe: all U.S. mid and large cap stocks with average daily dollar volume above $1 million.
- Entry trigger: daily close above 52-week high with volume ≥ 1.5× the 50-day average.
- Entry execution: buy at the next day’s open (simulates real world slippage; you can’t buy the close that triggers the signal).
- Position size: equal dollar amounts per trade (e.g., $10,000 per position in a $100,000 portfolio).
- Stop loss: 5 percent below entry price, executed at the next day’s open if triggered.
- Profit target: 10 percent above entry, or exit after 20 trading days, whichever comes first.
- Commissions: $1 per trade (reflects modern zero commission environment; older backtests should include $5–$10).
Lookback windows tested:
- 200 trading days (~9 months)
- 252 trading days (1 year)
- 756 trading days (3 years)
Key metrics to calculate:
- Total trades: number of setups triggered.
- Win rate: percentage of trades that hit the profit target before the stop.
- Average win: mean return of winning trades.
- Average loss: mean return of losing trades (should cluster near, 5% given the stop).
- Profit factor: (total winning $ / total losing $); values above 1.5 indicate a profitable system.
- Max drawdown: largest peak to trough decline in equity during the test period.
- CAGR: compound annual growth rate of the strategy.
- Sharpe ratio: risk adjusted return (CAGR / standard deviation of returns).
Sample results (hypothetical 3-year backtest, 2023–2026):
| Metric | Value |
|---|---|
| Total Trades | 487 |
| Win Rate | 44% |
| Average Win | +12.3% |
| Average Loss | -5.1% |
| Profit Factor | 1.68 |
| Max Drawdown | -22% |
| CAGR | 14.2% |
| Sharpe Ratio | 0.91 |
A 44 percent win rate with an average win more than double the average loss produces a profitable system. The profit factor of 1.68 means you make $1.68 for every dollar you lose. Max drawdown of 22 percent is tolerable for an aggressive momentum strategy. Expect to see your equity dip by that amount at some point.
Sector level performance breakdown (3-year backtest):
| Sector | Total Trades | Win Rate | Avg Return |
|---|---|---|---|
| Technology | 142 | 48% | +6.8% |
| Healthcare | 89 | 41% | +4.2% |
| Consumer Discretionary | 76 | 46% | +5.9% |
| Industrials | 62 | 39% | +3.1% |
| Financials | 54 | 37% | +2.4% |
| Energy | 31 | 35% |