
What if waiting for “all clear” headlines means you already missed the best part of the rebound?
Stocks often peak before a recession and start rallying while GDP and payrolls still look awful.
This piece cuts through the noise and gives a simple plan: how a stock market recession works, which indicators to watch (yield curve, unemployment, PMIs or Purchasing Managers Index), defensive sectors to favor, and clear key levels for entries and stop-losses.
Read on for a practical watchlist and the exact signs that would make me step aside.
Understanding How a Stock Market Recession Works

The National Bureau of Economic Research calls a recession when there’s a big, widespread, and lasting decline in economic activity. You’ve probably heard the shortcut version: two straight quarters of falling GDP equals a “technical recession.” But NBER doesn’t rely on that alone. They look at GDP, personal income, employment, factory output, and retail sales before making the call. Here’s the thing: an economic recession measures the whole economy, while a stock market recession (or bear market) just means equity prices have dropped 20 percent or more from recent highs. They usually happen together, but not always. Markets can tank without an official recession, and recessions can kick off after stocks have already tumbled.
Stock markets look forward because investors price in future earnings and corporate health months before the official data catches up. When earnings forecasts drop, the present value of equities falls, pushing prices down before you see layoffs or GDP contractions in the news. The typical pattern? Markets peak before a recession starts, keep falling for several months after it begins, and bottom out roughly six months in. Often they’re rallying before the broader economy shows any real improvement.
That timing gap matters. Since 1945, the S&P 500 has averaged a 1 percent gain during recession periods themselves. Sounds weird, right? It’s because stocks peak early and start recovering while unemployment is still climbing and GDP is still weak. Markets anticipate both the decline and the turn. Waiting for “all clear” headlines usually means you’ve already missed the early rebound.
Major causes of recessions:
Unexpected economic shocks like pandemics, wars, natural disasters, or sudden energy and supply-chain disruptions.
Loss of consumer confidence that makes households cut spending, which is about 70 percent of U.S. GDP.
High interest rates that make borrowing expensive, slow business investment, and reduce big-ticket purchases like homes and cars.
Asset bubbles that burst, destroying wealth and forcing people to dump overvalued holdings.
Tight credit conditions where banks pull back on lending, starving businesses and consumers of capital.
Policy mistakes like tightening too soon, cutting fiscal support too fast, or trade conflicts that mess up commerce.
Key Recession Indicators Signaling Stock Market Stress

Investors watch a bunch of leading and coincident indicators to gauge recession risk and position portfolios ahead of trouble. Rising unemployment is one of the clearest: when jobless claims spike and the unemployment rate climbs, consumer spending falls, corporate revenues weaken, and equities typically drop. Two consecutive quarters of GDP contraction meet the technical recession rule and confirm the economy is shrinking, though markets often price that in well before the official data drops. Purchasing Managers Index (PMI) readings below 50 mean manufacturing is contracting. When service PMIs also fall below 50, the signal gets stronger. The Consumer Confidence Index tracks household sentiment about current conditions and future expectations. Sharp drops in confidence come before pullbacks in discretionary spending and correlate with market downturns.
Yield-curve inversion (when short-term Treasury rates rise above long-term rates) has preceded every U.S. recession over the past 50 years, usually by 12 to 18 months. The market reads inversion as a sign the Federal Reserve has tightened policy too much, choking off growth and leading bond investors to expect rate cuts later. Credit spreads widening between corporate bonds and Treasuries signal lenders see rising default risk, another sign of stress ahead. Together, these indicators help you assess whether a recession is coming, happening now, or fading, and whether defensive positioning makes sense.
| Indicator | What It Signals | Typical Market Reaction |
|---|---|---|
| Yield-Curve Inversion | Fed policy too tight; growth slowdown ahead | Shift to defensive sectors, raise cash levels |
| Rising Unemployment Rate | Consumer spending will weaken; corporate revenue at risk | Reduce cyclical exposure, add staples and utilities |
| Two Quarters GDP Decline | Economy in technical recession; earnings downgrades likely | Volatility spikes, P/E ratios compress |
| PMI Below 50 | Manufacturing or services contracting | Investors rotate out of industrials and materials |
| Consumer Confidence Drop | Households cutting discretionary spending | Retail, leisure, and consumer discretionary stocks fall |
Historical Stock Market Behavior During Recessions
The dot-com recession ran from March 2001 to November 2001, eight months total, triggered by the collapse of tech and internet stocks that had soared on speculative valuations. During that stretch, the S&P 500 fell 8.2 percent as investors fled growth names and earnings estimates for tech companies evaporated. The downturn was relatively shallow compared to what came later. The market began stabilizing by late 2001 even though job growth stayed weak for months.
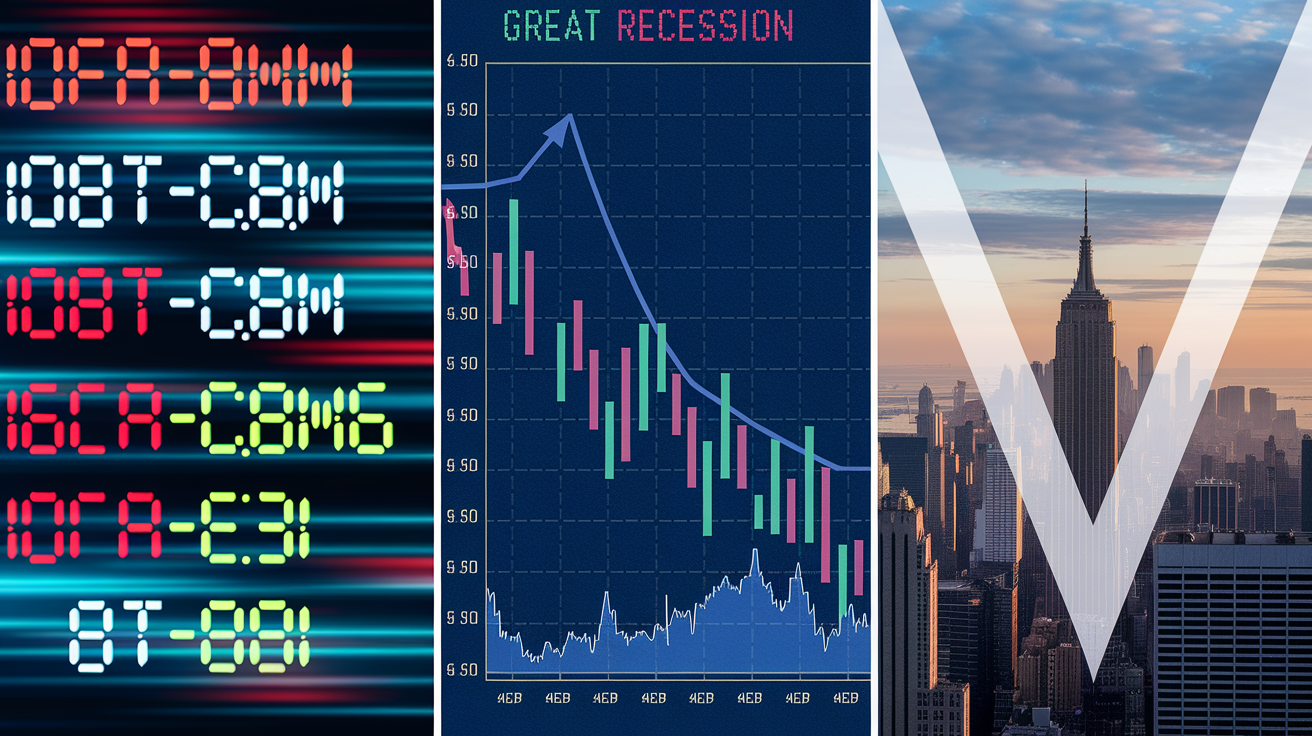
The Great Recession from December 2007 to June 2009 was the deepest and longest downturn since the Great Depression, sparked by the housing bubble and the financial system collapsing. The S&P 500 declined almost 38 percent during the 18-month recession, with the index losing more than half its value from peak to trough when you measure from October 2007 to March 2009. U.S. GDP contracted for three straight quarters, unemployment soared to 10 percent, and major financial institutions failed or needed government bailouts. Recovery was slow and uneven, but equities began their climb in March 2009, well before the labor market or housing prices stabilized.
The COVID-19 recession in February and April 2020 was the shortest on record. Just two months. But it featured one of the fastest and steepest market declines in history. The S&P 500 dropped roughly 34 percent in a matter of weeks as lockdowns shut down entire sectors and millions filed for unemployment. Aggressive monetary stimulus (near-zero rates, asset purchases, and fiscal support) fueled a rapid rebound. The index not only recovered its losses by August 2020 but went on to post strong gains through the rest of the year.
Markets rally before recessions officially end because investors anticipate the turn: corporate earnings will stabilize, central banks will ease policy, and fiscal stimulus will flow. By the time GDP returns to growth and unemployment starts falling, stock prices have typically already recovered a big chunk of their losses. Waiting for “all clear” economic data means missing the early leg of recovery, which is often the strongest.
Four consistent recession-era market patterns:
- Markets peak before the recession starts, often by several months, as forward-looking investors price in weaker earnings.
- Declines accelerate in the early months of a recession, when uncertainty is highest and earnings downgrades pile up.
- Market bottoms occur roughly six months into a recession, ahead of any clear improvement in employment or GDP.
- Recoveries begin while the economy is still weak, driven by expectations of future improvement and central bank support.
Defensive Sectors and Recession-Resistant Stocks in Market Downturns

Consumer staples, utilities, and healthcare have historically beaten broader indexes during recessions because demand for their products and services stays relatively stable no matter what’s happening in the economy. Households still buy groceries, pay electric bills, and refill prescriptions even when discretionary budgets get slashed. These sectors also tend to pay higher dividend yields, providing income support when capital gains are scarce. Walmart shows the consumer-staples thesis in action: the company posted gains of 21 percent in 2020, 18 percent in 2008, and 3 percent in 2007 during recession years, benefiting from its position as a low-cost grocer and the shift toward value-conscious shopping.
Utilities deliver essential services under regulatory frameworks that often guarantee stable returns, insulating earnings from economic swings. Healthcare demand is driven by demographics and medical need rather than consumer sentiment, making the sector less sensitive to GDP moves. Investors also evaluate individual stocks for recession resilience based on pricing power, competitive moats, and balance-sheet strength. Philip Morris International benefits from the relatively inelastic demand for tobacco and nicotine products. Cigarette volumes internationally have held up better than in the U.S. The company’s pipeline of smoke-free products like Zyn nicotine pouches and Iqos heated-tobacco devices offer higher-margin growth opportunities even in weak economies.
Netflix provides a different angle on recession resistance: entertainment that costs far less than alternatives. The company posted gains of 84 percent in 2009, 12 percent in 2008, and 67 percent in 2020 as consumers traded down from expensive outings to low-cost streaming. Its ad-supported tier and growing ad business expand the addressable market during downturns, while avoiding the capital intensity and risk of theatrical distribution preserves balance-sheet flexibility. Investors evaluating recession-resistant stock ideas have turned to sources like Predictions Markets Are Pointing to a Potential Recession for near-term signals and stock candidates.
Five defensive sector advantages:
Price stability for essential goods and regulated services reduces revenue volatility.
Demand consistency because consumers can’t defer or eliminate purchases like food, electricity, and healthcare.
Dividend support that provides income even when share prices are flat or falling.
Regulatory stability in utilities and certain healthcare subsectors that limits downside risk.
Lower beta relative to the broader market, meaning smaller percentage swings during volatility spikes.
Corporate Earnings, Valuations, and Market Mechanics in a Recession

Recessions compress corporate earnings as revenue growth slows, margins narrow, and cost-cutting can’t offset the decline in demand. Analysts revise earnings estimates downward, and the present value of future cash flows falls, pulling stock prices lower. When earnings expectations drop 20 percent, equity valuations must adjust unless investors are willing to pay higher price-to-earnings multiples. That rarely happens in periods of rising uncertainty. P/E ratio compression occurs when investors demand a lower multiple for each dollar of earnings because of elevated risk, further accelerating price declines even if earnings hold up better than feared.
Corporate asset values and collateral also decline during recessions, worsening firms’ financial conditions and reducing the value of projects and investments. Companies with high debt loads face tighter credit conditions, rising interest expenses, and potential covenant breaches, leading to forced asset sales or equity dilution. Financial stress spreads through the system as weaker firms cut spending, lay off workers, and reduce orders from suppliers, creating a negative feedback loop that deepens the downturn. Market liquidity dries up as trading volumes fall, bid-ask spreads widen, and institutional investors pull back, amplifying price swings and making it harder to exit positions without taking steep losses.
Increased uncertainty drives investors to shift from stocks to safer assets like Treasury bonds, money-market funds, and gold. The VIX (the market’s “fear gauge”) typically spikes during recessions as implied volatility rises and options traders price in larger expected price swings. Margin calls force leveraged investors to sell holdings to meet collateral requirements, adding to selling pressure regardless of fundamental value. These mechanical effects can push prices well below intrinsic value in the short term, creating opportunities for patient investors but also testing the resolve of anyone trying to hold through the turbulence.
Bonds, Cash, and Safe-Haven Assets During a Stock Market Recession

U.S. Treasury bonds are the classic safe haven during recessions because they’re backed by the full faith and credit of the federal government and their prices typically rise when stocks fall. As recession fears grow, investors bid up Treasuries, pushing yields lower and providing capital appreciation on top of coupon income. The 10-year Treasury yield often falls 100 to 200 basis points during recessions as the Federal Reserve cuts short-term rates and flight-to-quality demand increases. Long-duration bonds benefit the most from falling yields, making them an effective hedge against equity risk.
Cash and money-market funds preserve capital and provide optionality, letting you deploy funds quickly when attractive opportunities emerge. Cash earns minimal returns, but it eliminates downside risk and gives portfolios breathing room during periods of extreme volatility. High-grade corporate bonds from investment-grade issuers offer higher yields than Treasuries with relatively low default risk, though credit spreads widen during recessions as investors demand more compensation for any credit exposure. Municipal bonds can be attractive for taxable accounts, especially if issued by stable state or local governments, but revenue-dependent munis face risk if tax receipts fall sharply.
Gold has served as a safe haven for centuries, often rising during recessions as currency values are questioned and central banks ease policy. Gold doesn’t pay income, but it holds intrinsic value and tends to move inversely to risk assets. Bitcoin and cryptocurrencies showed mixed behavior during the 2020 recession: Bitcoin initially crashed alongside equities, falling more than 50 percent in March, but then surged over 300 percent in the months following the downturn as monetary stimulus flooded the system. That volatility relative to gold shows crypto assets remain high-risk, high-reward plays rather than stable safe havens, though long-term holders who bought near mid-2020 lows got rewarded.
Four safe-haven characteristics:
Low or negative correlation to equities, providing diversification when stocks fall.
Liquidity that allows rapid entry and exit without large transaction costs.
Capital preservation that protects portfolio value during drawdowns.
Income or intrinsic value that supports long-term returns even if prices stagnate.
Portfolio Strategies to Navigate a Stock Market Recession

Maintaining a long-term investing mindset is the foundation of recession-ready portfolios because markets have historically recovered from every downturn and delivered positive returns over multi-year horizons. Dollar-cost averaging (investing a fixed amount on a regular schedule) smooths entry points and reduces the risk of deploying all capital at the peak. During recessions, DCA lets you buy more shares at lower prices, lowering the average cost basis and positioning portfolios for stronger gains when recovery begins. Buying discounted quality assets gradually rather than attempting to time the exact bottom reduces emotional decision-making and takes advantage of volatility without requiring perfect market calls.
Defensive weighting shifts portfolio allocations toward sectors and stocks that have historically held up better during downturns: consumer staples, utilities, healthcare, and high-quality dividend payers. You can reduce exposure to cyclical sectors like industrials, materials, and discretionary retail that are more sensitive to GDP swings. Diversification across asset classes (stocks, bonds, cash, and alternative investments) ensures not all holdings are exposed to the same risks. A cash reserve of 6 to 12 months of expenses or 10 to 20 percent of portfolio value provides liquidity to cover needs or take advantage of opportunities without forced selling at unfavorable prices.
Rebalancing periodically (quarterly or semiannually) maintains target allocations and forces a disciplined approach of selling assets that have outperformed and buying those that have lagged. During recessions, rebalancing often means adding to equities when prices are depressed and trimming bond or cash positions that have held value. Stop-loss orders can limit downside on individual positions, though they risk locking in losses during temporary volatility. Hedging with options (buying put options or put spreads) provides downside protection at a known cost, letting you cap potential losses while maintaining upside exposure. For broader portfolios, inverse ETFs or futures contracts can hedge equity risk, though these tools require understanding of leverage and timing.
Investors have used multiple frameworks to evaluate recession-resistant stock ideas, including assessments from Predictions Markets Are Pointing to a Potential Recession and foundational research on How is an economic recession defined? when constructing defensive allocations.
Six practical steps for recession-ready investing:
- Build a cash cushion of 10 to 20 percent of portfolio value to fund opportunities and reduce forced selling.
- Tilt toward high-quality stocks with strong balance sheets, consistent cash flow, and durable competitive advantages.
- Increase allocation to defensive sectors such as consumer staples, utilities, and healthcare.
- Add U.S. Treasury bonds or high-grade corporates to reduce portfolio volatility and provide income.
- Use dollar-cost averaging to deploy cash gradually rather than all at once.
- Review and rebalance quarterly to maintain target allocations and capture relative-value opportunities.
Risk Signals, Monitoring Tools, and Early-Warning Triggers for Investors

Credit spreads between corporate bonds and Treasury yields widen as lenders demand higher compensation for default risk, signaling financial conditions are tightening and recession risk is rising. When high-yield spreads (the difference between junk-bond yields and comparable Treasuries) climb above 500 to 600 basis points, historical patterns suggest elevated recession probability. Corporate earnings revisions also provide real-time insight: when a majority of companies in the S&P 500 are reporting negative earnings surprises and analysts are cutting forward estimates, the market typically reprices lower. Yield-curve inversion remains one of the most reliable leading indicators, with the 2-year/10-year Treasury spread offering the clearest signal. Sustained inversion has preceded every recession over the past half-century.
Rising corporate debt levels and leverage ratios increase vulnerability to economic shocks. Companies with debt-to-EBITDA ratios above 4 or 5 face refinancing risk and potential covenant breaches if earnings fall, making them candidates for downgrade or distress. Monitoring sector-specific leverage (commercial real estate debt or energy-sector borrowing, for example) can highlight pockets of risk before they spread to the broader market. Hedging tools like put options on broad indexes or sector ETFs offer downside protection at a known cost, while futures contracts can provide more leveraged hedges for sophisticated investors willing to manage margin and liquidity requirements.
| Signal | Why It Matters | Investor Action |
|---|---|---|
| Credit Spreads Widening Above 500 bps | Lenders see rising default risk; financial stress building | Reduce high-yield bond exposure, raise cash, tilt to quality |
| Earnings Revisions Turning Negative | Analysts cutting estimates; corporate outlook weakening | Trim cyclical stocks, add defensive sectors |
| 2/10 Treasury Yield Inversion | Fed policy too tight; recession likely within 12 to 18 months | Begin defensive positioning, increase bond allocation |
| Corporate Debt-to-EBITDA Above 5x | High leverage increases risk of distress if earnings fall | Avoid overleveraged names, focus on strong balance sheets |
Opportunities That Emerge During a Stock Market Recession

Recessions reset valuations, often pushing quality companies to prices not seen in years and creating entry points that deliver outsized long-term returns. The March 2009 trough of the Great Recession marked the beginning of an 11-year bull market. Investors who added exposure near the bottom earned annualized returns well above historical averages. The April 2020 low during the COVID recession was followed by a rapid recovery and new all-time highs within months, rewarding those who maintained discipline and deployed capital when fear was highest.
Value stocks (those trading at low price-to-earnings or price-to-book ratios) have historically beaten growth stocks in the early stages of recoveries because they’re more deeply discounted and carry less sensitivity to rising interest rates. Small-cap stocks tend to be more volatile during recessions but can deliver stronger rebounds once the economy stabilizes, especially those with solid balance sheets and exposure to domestic demand. Identifying oversold assets requires screening for fundamentally strong companies whose prices have fallen due to broad market panic rather than company-specific deterioration. Metrics like price-to-earnings ratios, price-to-book ratios, and free-cash-flow yields help pinpoint candidates trading below intrinsic value.
A long-term investing mindset is essential because timing the exact bottom is nearly impossible. Attempting to do so often results in missed opportunities or emotional whipsaws. Recessions test conviction, but they also compress years of potential gains into short windows when volatility is highest. Investors who stay disciplined, maintain diversification, and deploy capital gradually during downturns position themselves to capture the full recovery and build wealth over decades.
Five types of opportunities available during downturns:
Blue-chip stocks at multi-year low valuations, offering both capital appreciation and dividend income.
High-quality bonds at wider spreads, providing attractive yields with manageable credit risk.
Sector rotation plays into early-cycle and recovery-sensitive names before broader recognition.
Oversold small-caps with strong balance sheets, which can deliver explosive gains in the recovery phase.
Real-asset investments like real estate or commodities that benefit from eventual reflation and supply constraints.
Final Words
In the action we defined recessions, showed why markets tend to lead the economy, and laid out the top indicators, historical patterns, defensive sectors, and portfolio moves to consider.
Watch the signals: yield-curve, PMIs, earnings, credit spreads. Trim or hedge where risk is high, keep cash for opportunities, and favor quality if you scale in.
If you stay disciplined and follow the signals, a stock market recession can become a buying window for patient investors. Stay prepared and optimistic.
FAQ
Q: What happens to the stock market in a recession?
A: The stock market in a recession typically falls and gets more volatile as earnings and risk appetite drop. Markets often top before the economy does—watch defensive sectors, bond yields, and support levels.
Q: Who owns 88% of the stock market?
A: The 88% of the stock market is owned mostly by the wealthiest households and big institutions—roughly the top 10 percent of U.S. households plus pension funds, mutual funds, and other institutional investors.
Q: Can I lose my 401k if the market crashes?
A: You can lose value in your 401k if the market crashes, but you won’t lose the account itself; stay diversified, keep a long-term view, rebalance, and hold emergency cash to avoid forced selling.
Q: Is 2026 going to be a recession?
A: Whether 2026 will be a recession is unknown; forecasts vary. Watch GDP, unemployment, yield-curve inversion, and corporate earnings. Prepare by trimming risk, holding cash, and favoring defensive sectors.