
Betting on approval dates is gambling disguised as investing.
Regulatory timelines are where the biggest gains and losses live, because FDA and EMA decisions turn speculation into binary outcomes.
This piece lays out the catalysts that matter, including INDs, Phase 2/3 readouts, NDA and BLA filings, advisory votes and PDUFA dates, then shows practical buy zones, key support and resistance levels, timing tactics, and clear invalidation rules so you can act, not guess.
If you trade biotechs, master the calendar and the odds first.
How Regulatory Milestones Influence Biotech and Pharma Stock Prices

Regulatory milestones work like trip wires for biotech stocks. You’re watching a company file an IND or dose its first Phase 1 patient, and suddenly the market’s repricing everything. What was speculative becomes tangible. Phase 2 data drops and beats expectations? The stock can jump 30% before lunch as traders recalculate approval odds and future revenue. But the reverse hits just as hard. A Complete Response Letter or a blown Phase 3 trial wipes out months of gains in one session because these outcomes are binary. The drug either gets to market or it doesn’t.
Timing’s everything. PDUFA dates, advisory votes, trial readout windows. Investors build positions weeks early, then tweak their exposure as the event closes in. Trading volume spikes. Options premiums go nuts. A lot of small and mid-cap names live or die on a single FDA decision, which is why you’ll see a 50% pop on approval and a 60% crater on rejection. It’s not subtle.
Pre-announcement trading creates its own momentum. News that a PDUFA date’s coming or Phase 3 interim data’s due? The stock starts climbing as speculators and event funds pile in. If everyone already expects approval, the actual news might disappoint. The move’s already happened. But surprise approvals or better-than-expected efficacy? Those generate the explosive moves, especially when the Street had written off the odds.
Here’s what investors watch closest:
- IND acceptance and Phase 1 start – green light for human trials, validates all the preclinical work
- Phase 2 and Phase 3 readouts – the big binary events where efficacy either shows up or doesn’t
- NDA or BLA submission and acceptance – formal filing kicks off the PDUFA countdown, shows management thinks the data package holds
- Advisory panel meetings and votes – technically non-binding, but negative votes usually predict rejections or CRLs
- PDUFA decision – the ultimate binary. Market access opens or the door slams shut.
Understanding Key Regulatory Pathways and Timelines
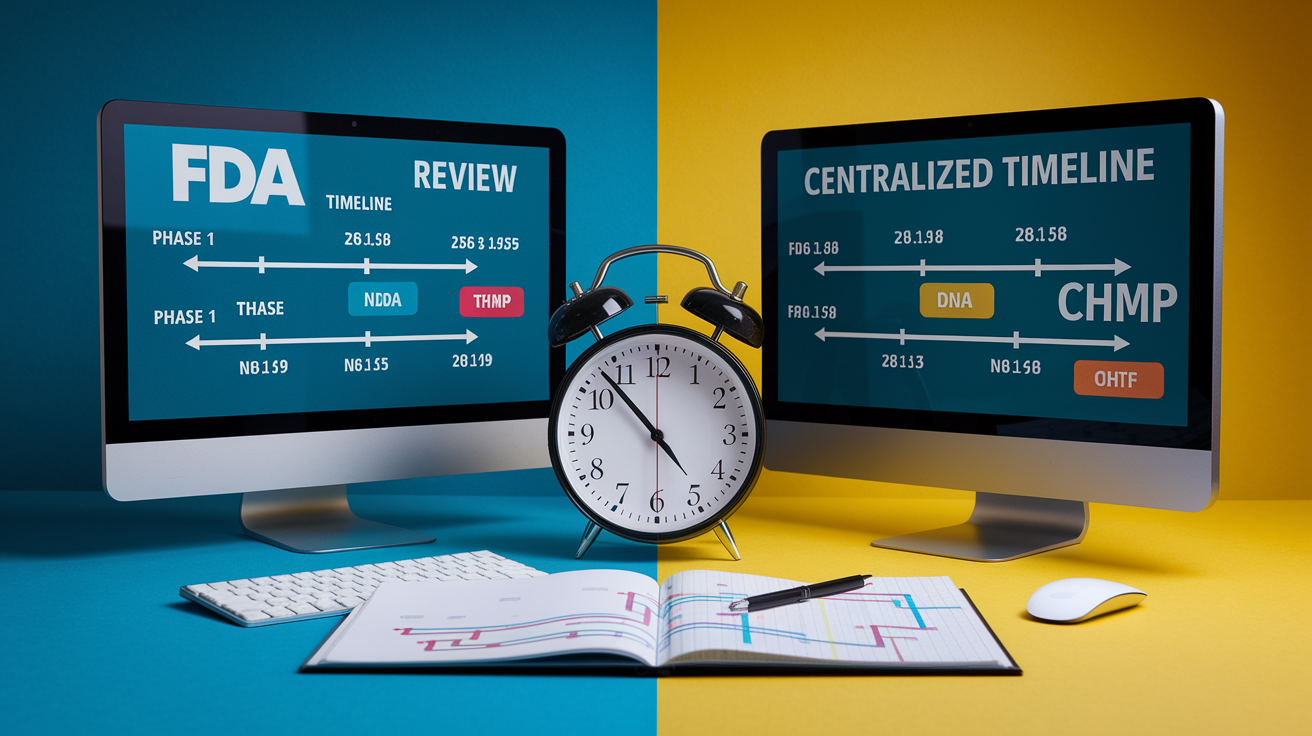
FDA and EMA both run multi-stage review systems, but the details differ. In the U.S., you start with an IND filing that lets you dose humans. Phase 1 tests safety and dosing. Phase 2 checks for efficacy signals in a bigger group. Phase 3 delivers the pivotal data you need for your NDA or BLA. Once you submit, FDA assigns a PDUFA date, six months for priority review, ten for standard. They dig into everything. Sometimes they convene an advisory committee. If they find problems, you get a Complete Response Letter listing what needs fixing before approval.
EMA’s process looks similar but isn’t identical. After preclinical work, sponsors enter national or centralized procedures. The Committee for Medicinal Products for Human Use leads the scientific review. Standard takes about 210 days, accelerated cuts that to 150 for products hitting unmet need. EMA also offers conditional approvals based on interim data, with confirmatory studies required post-launch. Both agencies allow rolling submissions, priority tracks, orphan pathways. Each one compresses timelines but adds procedural steps.
Timelines vary wildly depending on product complexity and regulatory history. A straightforward generic might clear 510(k) in months. A novel gene therapy with no precedent can spend years in review, inspections, back-and-forth. Advisory panels tack on weeks. Manufacturing site inspections can trigger delays. Any safety signal that pops up mid-review? Clock resets or you’re back in trial design.
| Milestone | Typical Duration |
|---|---|
| IND submission to Phase 1 start | 30–90 days |
| Phase 1 completion | 6–12 months |
| Phase 2 completion | 6–24 months |
| Phase 3 completion | 12–48 months |
| NDA/BLA submission to acceptance | 60 days (filing decision) |
| FDA review to PDUFA decision | 6 months (priority) / 10 months (standard) |
Historical Stock Movement Patterns Around Major Approval Events
Biotech stocks deliver wild swings around regulatory news. Clean Phase 3 data for a breakthrough therapy? Mid-cap stock jumps 50 to 100 percent in days, especially if the indication’s big and competition’s thin. Failed trial or surprise CRL? Half the market cap vanishes overnight. Management’s left scrambling to preserve cash and salvage the pipeline. Volatility peaks hardest in the 10 days around PDUFA dates and readouts. Option premiums explode. Desks reposition fast.
Small-cap names with single-asset pipelines see the craziest moves. Gains of 100 to 200 percent aren’t rare when a pivotal trial beats and the approval path opens. Larger pharma companies move less in percentage terms because one approval is a smaller slice of total value. But even a blockbuster nod can add billions in market cap within hours. Negative outcomes hurt worst when investors priced in high success odds. Street expects approval, FDA hands out a CRL instead? Stock gaps down 60% or more as revenue potential and pipeline credibility both evaporate.
Anticipation trading shapes the pattern. Stocks run 20 to 40 percent in the weeks before a PDUFA as retail and event funds load up. Approval arrives as expected? Reaction’s often muted, modest single-digit gain or even a sell-off as traders bank profits. Surprise approvals or unexpectedly strong label language? Second wave of buying extends the rally for days or weeks.
Notable patterns worth tracking:
- Pre-event run-ups followed by profit-taking on approval, especially when consensus was already bullish
- Binary collapses of 50–80% when trials miss endpoints or panels vote no
- Sustained rallies for breakthrough therapies with clear commercial paths
- Sector ripples when a high-profile approval or rejection shifts sentiment across similar programs
Key Risks and Variables That Shape Approval-Driven Stock Outcomes

Regulatory outcomes depend on more than top-line efficacy. Trial design flaws can sink promising drugs at the advisory stage. Underpowered studies, bad endpoints, imbalanced patient groups. Safety signals that surface late in Phase 3 or during review often trigger new trials or outright rejections, extending timelines by years and burning cash. Manufacturing problems are another landmine. FDA inspections uncover contamination or quality lapses? Approval gets delayed indefinitely, even when clinical data looks solid.
Advisory votes add unpredictability. Non-binding, but a negative vote usually drives the FDA’s final call and craters the stock before the official ruling. Market sentiment matters too. If biotech’s in a downturn or risk-off mood dominates, even a clean approval might not lift the stock as much as it would in a bull run. Competitive dynamics play in. Rival drug wins approval first or shows better efficacy? Second entrant’s approval gets met with indifference or selling.
Regulatory uncertainty compounds everything. Timelines stay estimates until FDA or EMA issues formal guidance. CRLs arrive unexpectedly, demanding new trials or data that push commercialization out one to three years. Patent clocks keep ticking during delays, shrinking exclusivity and cutting peak revenue potential. Investors need to weigh probability scenarios and accept that even high-conviction plays carry real downside when the path gets bumpy.
Catalyst Calendars and How Investors Track Critical Dates

Serious biotech traders treat catalyst calendars like blueprints. Every PDUFA date, advisory meeting, Phase 3 readout window gets marked weeks or months early. These dates show up in press releases, SEC filings, investor decks. Diligent traders cross-reference multiple sources to confirm. A PDUFA date is FDA’s target decision deadline. They can extend, but the market prices it as a hard catalyst. Advisory meetings precede many approvals and carry their own binary risk since panel votes often predict the final ruling.
Phase 3 readout windows are fuzzier but just as critical. Companies announce estimated timeframes based on event-driven trial designs. “Mid-2025” or “second half.” Investors narrow the window by tracking enrollment updates, interim analysis schedules, management calls. When a company signals confidence or schedules a special update call, anticipation trading accelerates. Stock climbs in the days before the announcement.
Anticipation trading becomes its own strategy. Event-driven funds and retail build positions four to eight weeks before a major catalyst, aiming to catch the run-up and then decide whether to hold through or take profits early. Options activity spikes as the date nears. Implied volatility often doubles in the final week. Some use spreads to cap downside while keeping upside. Others sell short-dated calls to capture premium from traders betting on a big move.
Most tracked catalyst types:
- PDUFA action dates – FDA’s target for approval decisions, extensions possible but rare
- Advisory committee dates – panel votes that drive immediate volatility and predict FDA rulings
- Phase 2 and Phase 3 readouts – binary data releases that confirm or kill clinical hypotheses
- NDA and BLA submissions – formal filings that start the review clock and signal management confidence
- EMA CHMP opinions – European PDUFA equivalents, less precise timing but equally impactful for global names
Investment Approaches for Trading Regulatory Timelines

Pre-catalyst accumulation is straightforward. Spot an upcoming PDUFA or Phase 3 readout, assess success probability, build a position two to six weeks before the event. Ride the anticipation wave as others pile in, then decide whether to hold through the binary or lock in early. Works best when the catalyst’s well known, trial design’s solid, company has strong execution history. Risk comes from unexpected delays, negative leaks, or a crowded trade that collapses if sentiment flips.
Options offer asymmetric setups for traders willing to pay for volatility. Buy out-of-the-money calls before a positive catalyst, cap downside at premium, keep unlimited upside if approval drives a big move. Protective puts hedge long positions against trial failures or CRLs. Vertical spreads (buy a call, sell a higher strike) reduce net premium and define max gain and loss. Attractive when implied vol’s elevated. Post-approval momentum trading means jumping in after a positive decision, betting institutional buying and analyst upgrades sustain a multi-day rally.
Diversification across events smooths single-name binary risk. Event-driven funds often hold ten to twenty positions, each sized small enough that one failure doesn’t wreck the portfolio while winners more than offset losers. Demands deep research and disciplined tracking to monitor overlapping catalysts and adjust sizing as probabilities shift. Probability-weighted modeling helps. If a trial has 60% success odds and approval doubles the stock but failure cuts it in half, expected value math guides sizing and entry timing.
| Strategy | Primary Objective |
|---|---|
| Pre-catalyst accumulation | Capture anticipation run-up in weeks before PDUFA or readout |
| Options hedging (calls/puts) | Define downside risk while maintaining upside exposure to binary event |
| Post-approval momentum trading | Enter after positive decision to ride institutional buying and upgrades |
| Diversified event-driven portfolio | Spread risk across multiple catalysts to smooth volatility and capture net positive edge |
| Probability-weighted modeling | Size positions based on estimated success odds and payoff asymmetry |
Final Words
In the action: regulatory milestones, INDs, Phase readouts, NDA/BLA filings and final FDA or EMA decisions are the catalysts that move biotech and pharma shares.
We showed how timelines drive spikes and drops, how to build a catalyst calendar, and which events to put on your watchlist.
Practical plan: add PDUFA and readout dates to your watchlist, size positions for binary risk, consider options hedges or scaling in, and set clear entry, confirmation, and invalidation levels.
Keep a close eye on regulatory approval timeline stocks — stay disciplined, manage risk, and you can capture repeatable opportunities ahead.
FAQ
Q: How long does it take for regulatory approval? / What is the timeline for FDA approval?
A: The regulatory approval timeline typically runs from IND submission to final review and often takes 6–10+ years: Phase 1 months, Phase 2 about 1–2 years, Phase 3 1–4 years, then 6–12 months review.
Q: Do stocks go up after FDA approval?
A: Stocks often jump after FDA approval, with sharp short-term spikes as buyers rush in; outcomes depend on expectations, label, and commercial outlook—use position sizing and watch the catalyst timing.
Q: What are the 5 phases of FDA approval?
A: The five FDA phases are preclinical/IND submission, Phase 1 (safety), Phase 2 (efficacy and dose), Phase 3 (confirmatory trials), and NDA/BLA review that leads to approval or rejection.