Want a recession play that actually gains when incomes fall?
Dollar General (DG) has proven it, with comp sales spiking in 2008 and 2020 as shoppers traded down.
It’s consumables-heavy mix, rural footprint, and clean balance sheet make DG a natural defensive pick when budgets tighten.
Thesis: investors should watch comps, margin recovery, and cash flow conversion as the main triggers to buy or trim.
If markdowns, rising shrinkage, or traffic deterioration persist, this setup breaks.
How Dollar General Performs in Economic Downturns
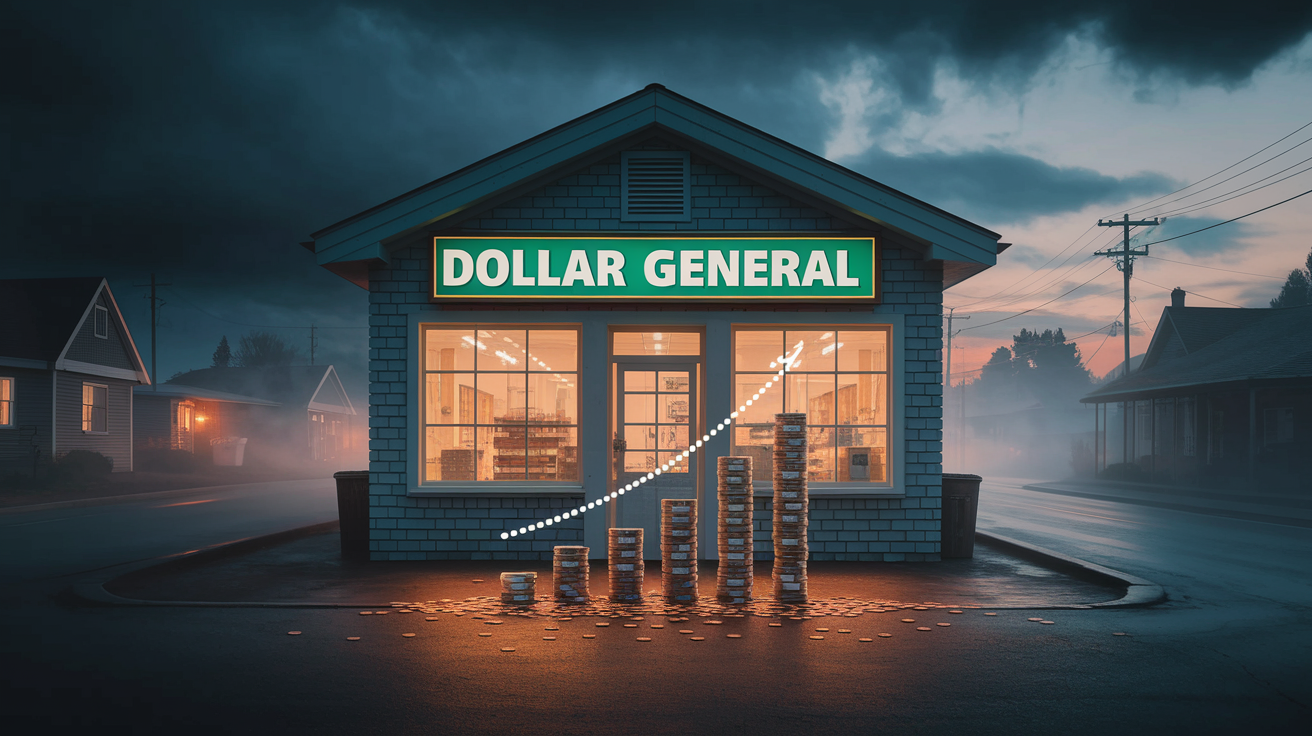
Dollar General’s got a track record that really stands out when the economy goes sideways. During the 2008 crisis, comp sales jumped to 9.0 percent, more than triple the 2.5 percent average they’d been running before things fell apart. Same thing happened in 2020. When COVID hit and everyone’s world turned upside down, same store sales shot up 16.3 percent after averaging just 3.3 percent the three years before. You see the same pattern every time: households get squeezed, they start caring a lot more about price, and Dollar General becomes the obvious choice.
The company strung together 31 straight years of positive comp growth before 2021 broke the streak. That wasn’t a weakness thing, just pandemic spending patterns snapping back to normal. Similar spikes showed up in the early ’90s downturn and again in 2001. The most recent quarter saw comps up 1.2 percent, with consumables (about 80 percent of sales) growing around 6 percent even as non-consumables dropped. Makes sense when you look at who’s shopping there: roughly 70 percent of customers earn under $35,000 a year. When budgets tighten, that group moves fast toward discount formats and daily necessities.
What happened in past recessions:
- Early 1990s: Comps climbed sharply as people traded down from mid-tier grocers and department stores.
- 2001: Positive momentum kept rolling, with the low price model pulling share from higher priced competitors.
- 2008 financial crisis: Comps hit 9.0 percent from a 2.5 percent baseline, driven by middle income households hunting for savings.
- 2020 pandemic: Same store sales reached 16.3 percent, the highest ever, fueled by stockpiling and stimulus checks.
- Post-pandemic: 2021 saw a 2.8 percent comp decline, then recovery to 4.3 percent in 2022. Shows how elastic Dollar General’s sales are to macro cycles.
Low income shoppers naturally gravitate here during downturns. They want smaller baskets, frequent trips, and proximity over one stop shopping at bigger retailers.
Sales Trends and Basket Behavior Linked to Recession Spending

Basket behavior shifts noticeably when economic conditions get worse. Transaction frequency goes up even as ticket sizes stay modest. Last quarter, average transaction size rose 2.3 percent, picking up slight inflation pass through and a modest bump in units per trip. Consumables delivered about 6 percent growth year over year while non-consumables dropped roughly 4 percent. Clear signal that customers prioritize food, beverages, paper goods, and cleaning supplies over seasonal merchandise and apparel when budgets get tight. Same store sales registered negative 0.1 percent year to date in 2023, with total sales growth coming mostly from new stores rather than traffic gains at existing locations. That pattern shows softening consumer confidence even before a formal recession starts.
| Category | Recession Trend | DG-Specific Data | Why It Matters |
|---|---|---|---|
| Consumables | Growth accelerates as essentials become budget priority | ~80% of sales mix; +6% YoY in recent quarter | Provides stable revenue base and shields top line from discretionary pullback |
| Non-Consumables | Declines sharply as households defer seasonal and apparel purchases | -4% YoY; markdowns expected to cost ~$95M through year-end | Margin headwind but inventory clearing frees cash and floor space |
| Average Transaction | Modest increase from unit uptick and small price adjustments | +2.3% in Q4; lower than inflation rate | Shows price elasticity remains high; customers resist larger basket inflation |
| Traffic | Typically rises as new customers trade down from higher-price channels | Flat to slightly negative YTD 2023; new stores offset weakness | Traffic normalization is key to comp recovery and margin leverage |
Gross Margin and Operating Margin Resilience During Recessions
Dollar General’s historical gross margin has hung around 31 percent over the long run, with operating margins averaging about 9 percent before the pandemic. During the COVID surge, operating margins climbed above 10 percent as sales leverage and reduced promotional activity supported profitability. Since then, margins have compressed to roughly 7 percent. Elevated markdowns, rising shrinkage, and increased labor and occupancy costs are the culprits. Earnings per share fell 25 percent year over year in the most recent quarter. That’s what happens when same store sales turn flat or negative and fixed costs eat a larger share of revenue.
Management’s been unusually specific about near term margin headwinds. Inventory markdowns on non-consumables are expected to create about a $95 million headwind through the rest of the year as the company clears seasonal and apparel merchandise that underperformed. Shrinkage (theft, damage, administrative error) is projected to add roughly $100 million in additional costs by year end, a significant deterioration from prior periods. Interest expense has surged approximately 50 percent year to date and doubled since early 2022, as the Fed’s rate hike cycle raises borrowing costs even for a retailer with minimal net debt. Labor hours per store have been increased to improve merchandising, checkout speed, and overall customer experience, while lease expenses keep climbing due to inflation indexing in occupancy agreements.
Key margin pressure factors right now:
- Markdown intensity: Non-consumables require aggressive clearance pricing to move inventory, compressing gross margin and reducing profitability per square foot.
- Shrinkage acceleration: Loss prevention challenges have intensified across discount retail, with organized retail crime and self checkout friction contributing to higher shrink rates.
- Labor investment: Additional hours improve store conditions but raise SG&A as a percentage of sales when comp growth stalls.
- Interest and occupancy inflation: Rising lease costs and higher interest on revolving credit facilities erode operating income even as sales hold steady.
Despite these headwinds, Dollar General’s historical ability to maintain gross margins near 31 percent during past recessions suggests the current compression may prove temporary if consumables regain share, shrinkage initiatives succeed, and the company returns to mid single digit comp growth.
Cash Flow Strength and Balance Sheet Stability in Recessionary Periods

Operating cash flow reached $3.0 billion in the most recent quarter, a 25 percent increase that shows Dollar General can convert earnings into liquidity even amid margin pressure. Inventories were trimmed 4 percent to $6.7 billion, reflecting disciplined working capital management as the retailer clears excess non-consumable merchandise and aligns stock levels with softer traffic trends. At year end, Dollar General held $2.3 billion in cash and investments and reported no debt. That’s a stark contrast to larger competitors and a critical advantage during economic downturns when credit markets tighten and refinancing risk rises.
The balance sheet stands out in the discount retail landscape. Walmart carries about $8.8 billion in cash but also shoulders roughly $47 billion in debt, while Target holds around $3.8 billion in cash against approximately $16 billion in liabilities. Dollar General’s zero debt status eliminates interest coverage concerns and provides maximum financial flexibility to invest in stores, technology, and inventory during periods when competitors may pull back capital spending. The stock currently trades at roughly 12.4 times trailing earnings and approximately 10 times free cash flow, multiples that historically expand when investors rotate toward defensive, cash generative retailers as recession fears mount.
Cash flow and liquidity advantages:
- Minimal leverage: No debt on the balance sheet removes refinancing risk and lowers the cost of capital during rate hike cycles.
- Strong conversion: Operating cash flow growth of 25 percent demonstrates earnings quality and the ability to fund growth without external financing.
- Inventory discipline: A 4 percent inventory reduction improves turns and frees working capital for opportunistic investments or shareholder returns when conditions normalize.
Store Footprint, Rural Advantage, and Operational Model Under Recession Stress
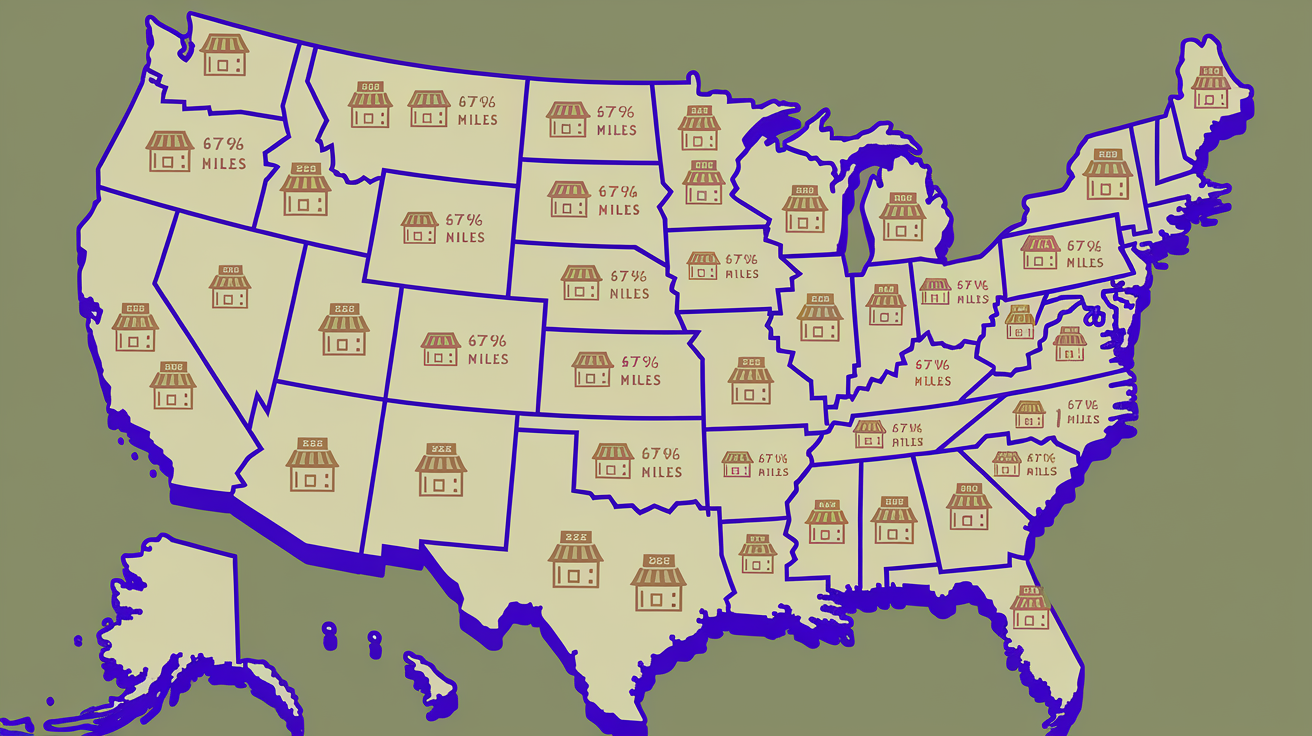
Dollar General operates approximately 20,345 stores across the United States and Mexico, blanketing rural and exurban markets where about 75 percent of Americans live within five miles of a location. Roughly 80 percent of stores are in towns with populations of 20,000 or fewer. Communities often underserved by large format competitors and where convenience and proximity trump selection breadth. The company plans to open 575 new stores in 2025, a moderation from the 800 originally planned for prior years, reflecting a strategic shift toward profitability and operational excellence over pure unit growth. This dense, small box footprint creates a defensive moat during recessions. Customers prioritize saving time and fuel over driving 15 to 20 miles to a Walmart Supercenter, especially when household budgets tighten and every dollar counts.
The operational model relies on low selling, general, and administrative expenses per square foot, a metric where Dollar General has historically outperformed peers. Stores average around 7,500 square feet, far smaller than traditional grocery or mass merchants. That enables lower occupancy costs, faster restocking, and simplified labor scheduling. During downturns, this lean cost structure translates directly into resilience. Fixed costs per store remain manageable even when traffic softens, and the company can sustain profitability at lower sales volumes than competitors operating larger, more complex formats. Inventory management also benefits from the small box approach, with shorter supply chains, faster turns on consumables, and reduced markdowns on slow moving non-consumable SKUs.
| Operational Factor | Recession Benefit | DG Metric |
|---|---|---|
| Proximity & Convenience | Customers prioritize nearby stores to save time and fuel costs; trips increase as households shop more frequently for smaller baskets | ~75% of U.S. population within 5 miles; ~80% of stores in towns ≤20,000 residents |
| Store Economics | Low fixed costs per location support profitability even at reduced traffic and transaction levels | Higher sales/sqft and lower SG&A/sqft than competitors; average store ~7,500 sqft |
| Expansion Capacity | Large whitespace (room for ~10,000 additional U.S. stores) allows continued unit growth and market share capture during and after downturns | 20,345 current stores; 575 new openings planned in 2025 |
The rural and small town orientation insulates Dollar General from direct competition with urban focused discounters and provides a natural hedge against economic cycles concentrated in metropolitan job markets.
Competitive Forces That Affect Recession Performance
Dollar General faces intensifying competition from Dollar Tree, Family Dollar, Walmart, and emerging hard discounters such as Aldi and Lidl, all of which sharpen value propositions when recession fears rise. In comparable periods, Dollar Tree posted same store sales growth of 7.8 percent while Family Dollar delivered 5.8 percent, both outpacing Dollar General’s 1.2 percent fourth quarter comp. Dollar Tree’s performance was driven in part by consumables growth of 11.7 percent, nearly double its 2.7 percent non-consumables increase. Reflects the retailer’s successful pivot from a strict $1.00 price point to $1.25 and higher tiers that capture inflation and improve basket size. Walmart remains the most formidable long term competitor, with basket studies indicating that a $40 grocery purchase can be approximately 10 percent cheaper at Walmart than at Dollar General. That gap pressures traffic when consumers have time to comparison shop and access to transportation.
Despite these headwinds, Dollar General has historically maintained superior sales per square foot and lower SG&A per square foot than most peers, advantages rooted in the small box format and consumables heavy assortment. The company’s rural footprint provides a buffer against direct Walmart competition in many markets, as the nearest Supercenter may be 15 to 20 miles away. Far enough that convenience and fuel costs offset Walmart’s price edge for frequent trips. Family Dollar, a Dollar Tree subsidiary, competes directly in overlapping geographies but has faced operational challenges, including store closures and slower inventory turns, that have limited its ability to capture share during the current cycle.
Five competitive pressure factors in recession scenarios:
- Dollar Tree price point evolution: The move to $1.25 and multi price tiers has unlocked stronger consumables growth and margin improvement, setting a pace Dollar General must match.
- Walmart’s scale and price leadership: Basket level savings of roughly 10 percent on identical items attract cost conscious shoppers willing to drive farther or consolidate trips.
- Aldi and Lidl expansion: Hard discounters with private label focus and aggressive pricing continue to enter U.S. markets, particularly in suburban areas where Dollar General also competes.
- Family Dollar restructuring: While currently underperforming, any turnaround at Family Dollar could recapture share in overlapping low income markets.
- E-commerce and delivery: Online grocery pickup and delivery from Walmart, Amazon Fresh, and Instacart reduce the convenience moat for small box stores, especially among younger, digitally native shoppers.
Stock Performance, Valuation Multiples, and Recession Sensitivity

Dollar General’s stock has dropped about 53 percent over the past year, trading near $75 per share and approaching levels last seen during the March 2020 pandemic sell off. The sharp drawdown reflects margin compression, earnings misses, and guidance that trails Street expectations. Management’s midpoint forecast of $5.48 earnings per share for 2025 falls short of the $5.85 consensus estimate. Current valuation multiples have compressed to roughly 12.4 times trailing earnings, well below the historical median price to earnings ratio of 16.6 times compiled by Value Line over the prior decade. On a normalized basis, assuming a return to the 9.2 percent operating margin that prevailed over the past ten years and adjusting for elevated interest expense, the stock trades at approximately 11 times net income and roughly 8 times pre-tax earnings. Levels that embed significant pessimism about the company’s ability to recover profitability.
Valuation sensitivity hinges almost entirely on margin normalization. If Dollar General can restore operating margins to the 9.2 percent long term average, the current share price implies minimal or no growth premium, even though the company has historically delivered mid single digit same store sales increases and 4 to 5 percent annual unit growth. A return to the 8.4 percent operating margin average seen in the three years before COVID would lift the multiple by roughly one turn, still leaving the stock attractively valued relative to historical norms. Conversely, if margins remain depressed near 7 percent due to sustained shrinkage, markdowns, and labor investments, the stock may struggle to re-rate even if top line growth resumes.
Key valuation considerations:
- Current multiples: ~12.4x trailing P/E and ~10x free cash flow reflect margin trough and guidance uncertainty.
- Normalized scenario: At 9.2% operating margin and current interest, stock trades ~11x net income, implying potential re-rating to historical 16.6x median if execution improves.
- Downside risk: Prolonged 7% operating margin would justify current or lower multiples, capping upside until profitability inflects.
Scenario Modeling: How Dollar General Could Perform in the Next Recession
Forward looking recession scenarios for Dollar General depend on the company’s ability to execute its “Back to Basics” operational reset, which prioritizes customer satisfaction, store level merchandising, and cost discipline over aggressive expansion. Management has identified room to build approximately 10,000 additional stores in the United States alone, providing a long runway for unit growth even if same store sales remain under pressure in the near term. Historical pre pandemic performance averaged roughly 2.7 percent comparable store sales growth and 4 to 5 percent annual new unit growth. If restored, that combination would support high single digit to low double digit revenue expansion over a multi year period. Shrinkage, interest expenses that have risen approximately 50 percent year to date, and ongoing markdown activity continue to weigh on near term earnings, making the path to margin recovery the critical variable in any recession model.
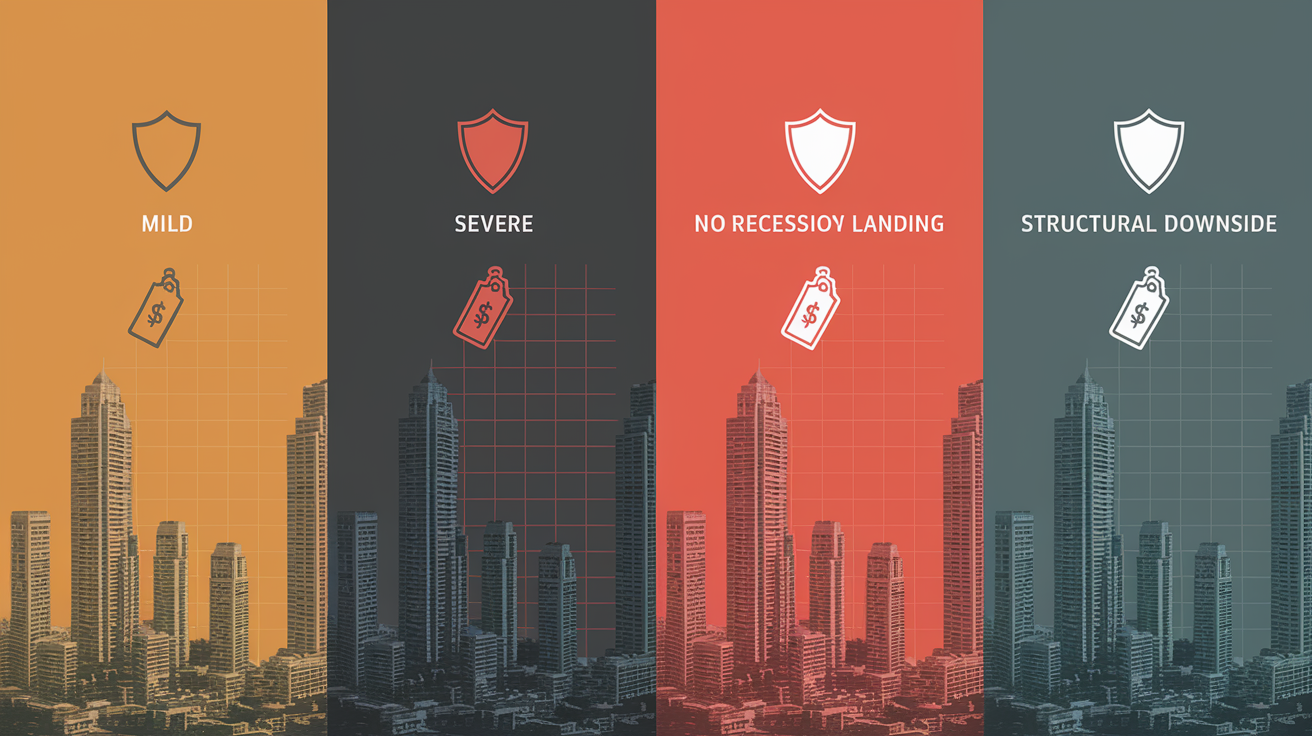
In a mild recession scenario, Dollar General would likely see same store sales accelerate to the 4 to 6 percent range as middle income households trade down and low income customers increase trip frequency to manage budgets. Gross margins could stabilize near historical norms of 31 percent if non-consumables clear and consumables regain mix, while operating margins recover toward 8.5 to 9 percent as leverage returns on positive comps. This outcome would support mid teens earnings growth and potential multiple expansion back toward the historical 16.6x median, delivering annualized total returns in the low 20 percent range over a five year period. A severe recession scenario with prolonged unemployment and sustained inflation would pressure transaction sizes and accelerate shrinkage, but the defensive nature of the consumables heavy model would still produce positive comps in the low single digits and preserve cash flow, limiting downside to high single digit annual returns driven primarily by earnings yield and modest growth.
The downside case assumes operating margins remain stuck near 7 percent due to structural shrinkage challenges, elevated labor costs, and intensified competition from Walmart and hard discounters. In this scenario, same store sales growth stalls near flat, new unit economics deteriorate, and the stock trades at a persistent discount to historical multiples. Even here, Dollar General’s clean balance sheet, strong free cash flow generation, and 10,000 store whitespace provide a floor. The company could still deliver roughly 13 percent annualized returns through a combination of normalized earnings yield and 4 to 5 percent unit growth, though meaningful capital appreciation would require a turnaround catalyst such as a breakthrough in loss prevention technology or a significant competitor stumble.
| Scenario | Key Drivers | Expected Impact | Risk Level |
|---|---|---|---|
| Mild Recession | 4–6% comps; margins recover to 8.5–9%; trade-down traffic accelerates; shrinkage stabilizes | Mid-teens EPS growth; multiple expands toward 16x; total returns low 20% annualized over five years | Moderate – dependent on “Back to Basics” execution and competitive response |
| Severe Recession | Low single digit comps; margins hold 7.5–8%; sustained unemployment pressures baskets; consumables anchor performance | High single digit EPS growth; modest multiple compression; total returns ~10–13% annualized | Moderate-High – prolonged margin pressure and competition from Walmart/Aldi could limit upside |
| No Recession / Soft Landing | 2–3% comps; margins grind toward 8%; normalization of shrinkage and markdowns; new units grow 4–5% annually | Mid single digit EPS growth; multiple remains range bound 12–14x; total returns ~8–10% annualized | Low-Moderate – stock may underperform if margins fail to inflect and comps remain muted |
| Structural Downside | Flat to negative comps; margins stuck at 7%; shrinkage persists; Walmart/Aldi capture share in overlapping markets | Flat to low single digit EPS growth; multiple contracts below 10x; total returns ~5–8% annualized | High – requires management missteps, competitive loss, or permanent shift in consumer behavior away from small box formats |
Final Words
In the action: Dollar General has historically gained share in recessions, with big comp spikes in 2008 and 2020, thanks to low-income shoppers trading down to essentials. That boost masks current margin pressure from markdowns and shrink.
Cash flow and a huge rural footprint give it stamina, but watch same-store sales, consumables mix, shrink, and margin guidance for signs of trouble.
If you want a trade or a sleeve in retail, watch the data first. dollar general recession performance looks like durable demand with room to rally if margins stabilize, so keep it on your watchlist.
FAQ
Q: Why is Dollar General struggling?
A: Dollar General is struggling because margin pressure from inventory markdowns, higher shrinkage and rising labor costs hurt earnings, while non-consumables fell and same-store comps weakened after long positive streaks.
Q: Is Dollar General recession proof?
A: Dollar General is not recession proof but is recession resilient: shoppers often trade down to essentials, driving comp spikes in 2008 and 2020, yet margin and operational headwinds can still cut profits.
Q: What goes up the most during a recession?
A: During a recession, consumables and small-ticket value items rise most; discount retailers gain traffic and basket share. Dollar General saw consumables grow about 6% and big comp spikes in past downturns.
Q: What is the 90% rule in stocks?
A: The 90% rule in stocks is an informal guideline to consider cutting a position if it loses roughly 90 percent of its value, since such a collapse usually signals a broken investment thesis.