
Think volume spikes are just noisy churn?
They’re often the clearest signal a breakout has real backing.
Today’s note flags live volume surge breakout stocks like NVDA, TSLA and MSTR and explains the exact evidence you need before pulling the trigger.
The thesis: breakouts that cross resistance on 1.5 to 2.5 times normal volume with follow through candles give a measurable edge.
Read on for the buy zones, confirmation checks, entries, stops and the one thing that proves you wrong.
Real-Time Volume Surge Breakout Opportunities

Recent volume surge breakout opportunities include:
- NVDA breaking $880 resistance with 210% volume, closing at $896 after four straight sessions near resistance.
- TSLA surging through $245 on 185% average volume with three rising candles (120%, 150%, 180% volume sequence).
- MSTR clearing $390 with a 240% volume spike, rallying to $425 within two sessions.
- PLTR breaking out of a consolidation channel at $75 with 195% volume, gaining 12% over the following week.
- COIN pushing above $230 on 160% volume after quiet accumulation, adding 15% within four days.
A volume surge breakout stock is any ticker that crosses a clear support or resistance level while volume jumps at least 50 percent above its 20 day average. Strong setups often show 100 to 250 percent volume surges. Think of a tech stock breaking $100 resistance with a 250% volume spike and rallying around 20%. Multi candle momentum confirmation works when you see three rising candles with volume increasing step by step, like 120 percent, then 150 percent, then 180 percent of the average. That sequence tells you buyers aren’t backing off and the move’s got legs.
High probability breakouts meet these six criteria:
- Volume at least 50% above the 20 day average at the moment price crosses the key level
- The volume spike occurs on the same candle that breaks resistance, not before or after
- Prior consolidation or range with quiet, stable volume for at least five sessions
- Alignment with at least one supporting indicator (OBV rising, CMF positive, RSI trending)
- Clear support or resistance level defined by prior touches or a horizontal zone
- Follow through candles holding above the breakout point with elevated volume continuing
During fast markets, traders apply these conditions by setting alerts for volume spikes on pre selected tickers, then checking whether the surge aligns with a breakout candle close. If volume spikes mid bar but price hasn’t closed above resistance, wait. If the close confirms and indicators agree, entries happen within seconds. Speed matters because institutional flow can move price 3 to 8 percent before retail catches up.
Technical Patterns Driving Volume Surge Breakout Stocks

Certain chart patterns naturally attract volume surges because they concentrate supply and demand into a narrow price zone. The most reliable patterns are consolidation breakouts. Tight ranges, flags, pennants, and cup and handle formations where volume dries up during the pattern build and then explodes when price finally clears the boundary. A breakout and retest setup adds extra confirmation: price breaks on heavy volume, pulls back on light volume to test the former resistance as new support, and then resumes higher on a second volume spike. That double confirmation structure filters out many false moves.
Each pattern has a volume threshold that separates signal from noise. A bullish engulfing candle needs at least 150 percent of average volume to carry weight. When that same pattern breaks resistance, you want 200 percent volume or more. A hammer appearing at support with 150 to 250 percent volume suggests strong rejection of lower prices. A doji with an unusual volume spike often signals an imminent directional move. Conversely, any breakout showing volume below 50 percent of the average, even if the candle looks bullish, carries higher failure risk and should be skipped.
The following table summarizes four common breakout patterns and their ideal volume confirmation levels:
| Chart Pattern | Ideal Volume on Breakout | Minimum Volume Threshold | Failure Risk if Below Threshold |
|---|---|---|---|
| Flag/Pennant | ≥200% of 20 day average | 150% | High – often fades back into pattern |
| Cup & Handle | ≥180% of 20 day average | 150% | Moderate – shallow cup depth increases risk |
| Range Breakout | ≥150% of 20 day average | 100% | Moderate – watch for retest before adding |
| Breakout & Retest | ≥150% on initial break, ≥100% on retest | 100% on retest | Low – two volume confirmations reduce whipsaws |
Indicators That Confirm Volume Surge Breakouts

Volume alone is noisy. Indicators smooth the signal and add context by showing whether the surge reflects buying pressure or simply chaotic churn. On Balance Volume (OBV) is a cumulative line that rises when closing price increases and falls when it decreases. When OBV rises ahead of price, it signals accumulation. Smart money quietly buying before the public notices. A breakout that follows a rising OBV trend has a much higher probability of follow through. Chaikin Money Flow (CMF) measures buying and selling pressure over the past 20 days. A reading above +0.20 indicates strong buying pressure, while anything below negative 0.20 signals distribution. Combine CMF above +0.20 with a volume surge and you have institutional confirmation.
RSI and MACD add momentum validation. RSI above 70 shows overbought conditions that can persist during strong trends, and RSI below 30 flags oversold zones where reversal breakouts often start. Align RSI direction with volume: if RSI’s climbing and volume surges on the breakout, the trend has fuel. MACD cross above the signal line during a breakout confirms that short term momentum is accelerating faster than the longer average. These oscillators don’t replace volume analysis. They confirm it. A breakout with heavy volume and a MACD bullish cross is stronger than one with volume alone.
Here are five numeric indicator thresholds that confirm breakouts:
- OBV trending upward for at least three sessions before the breakout candle
- CMF reading greater than +0.20 over the past 20 days
- RSI crossing above 50 or moving above 60 during the breakout, indicating momentum shift
- MACD histogram turning positive or MACD line crossing above the signal line within two bars of the breakout
- Volume exceeding 1.5 times the 20 day average on the breakout candle itself
How to Trade Volume Surge Breakout Stocks Step by Step

Trading volume surge breakouts is a repeatable workflow that starts before the market opens and ends with a defined exit plan. The best traders use a checklist so they don’t skip steps when price moves fast. Timing matters. Volume should spike on the breakout candle, not before or after. If volume surges two bars early, it’s often a trap. If it arrives late, the easy money’s gone.
Follow this eight step sequence:
- Identify a clear support or resistance level with at least three prior touches or a well defined horizontal zone.
- Wait for price to approach that level and watch for consolidation or quiet volume during the setup phase.
- Confirm that volume on the breakout candle is at least 1.5 to 2.0 times the 20 day average (or 3 to 5 times for intraday early session plays in the first 30 to 60 minutes).
- Let the candle close above resistance (for longs) or below support (for shorts) before placing any order. No mid bar entries.
- Check that at least one supporting indicator agrees: OBV rising, CMF positive, RSI trending, or MACD crossing.
- Enter immediately after the close if all conditions align, using a limit order slightly above the breakout candle high to avoid slippage.
- Place your stop loss just below the breakout level for long trades or just above it for short trades, risking no more than 1 to 2 percent of total capital.
- Set a profit target at the next resistance zone or use a trailing stop (like 1.5 times ATR) to lock in gains as the move extends.
Typical errors? Entering before the breakout candle closes, reacting to a single volume spike without checking context, and chasing price after it’s already moved 5 percent beyond the breakout level. Those mistakes turn a disciplined edge into a coin flip.
Risk Management for Volume Surge Breakout Stocks
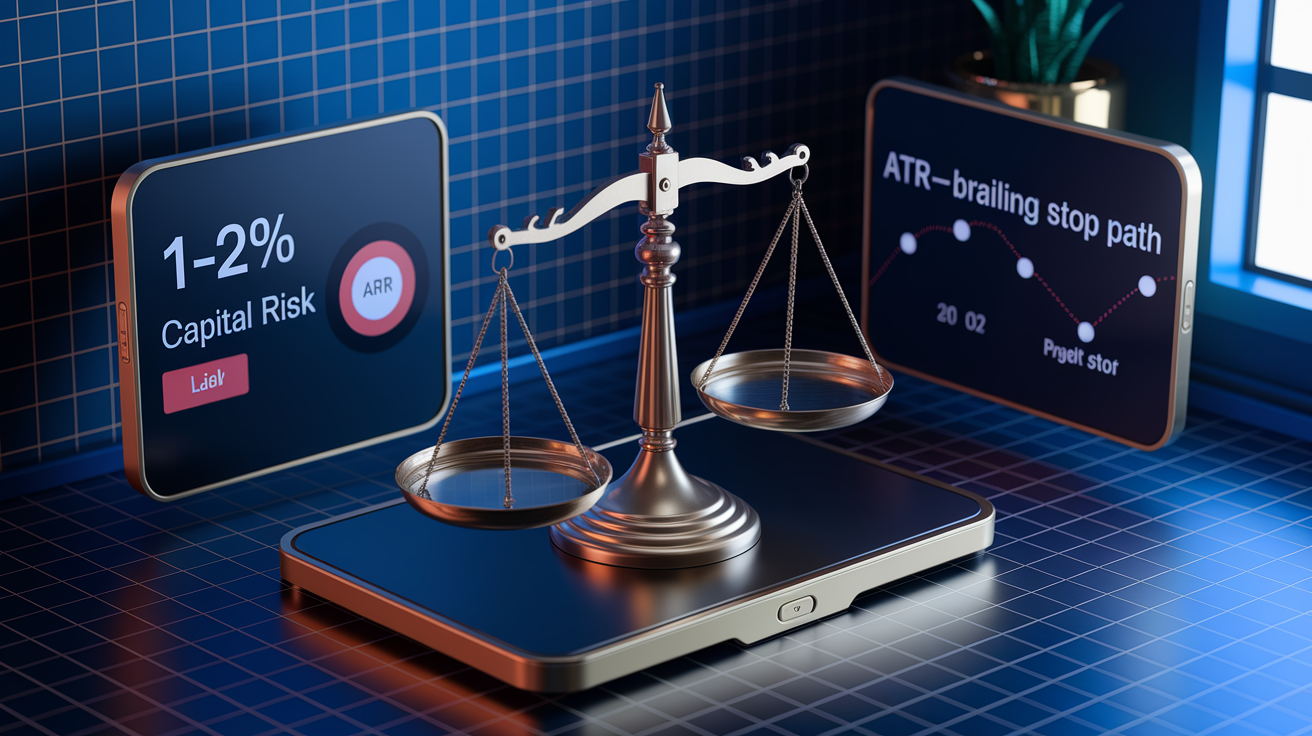
Breakout trading rewards precision but punishes overconfidence. The first rule is position sizing. Risk only 1 to 2 percent of your total capital on any single trade. A $50,000 account risks $500 to $1,000 per setup. If your stop is $2 away from your entry, you buy 250 to 500 shares. No more. This math keeps one bad trade from damaging your ability to take the next ten.
Stop placement anchors to the breakout level. For long entries, set the stop just below the breakout candle low or the resistance level that was cleared. For shorts, place it just above the breakdown candle high. That location gives the trade room to breathe without letting price reverse too far. As the trade moves in your favor, switch to a trailing stop using the Average True Range (ATR). A common approach is 1.5 times ATR. If ATR is $3, trail your stop $4.50 below the highest close since entry. This method protects gains during normal consolidation and exits automatically if momentum fades.
Core risk rules for breakout trading:
- Never risk more than 2 percent of capital per trade, even if conviction feels high
- Place stops just outside the breakout zone. Not so tight they get hit by noise, not so loose they ignore the invalidation level
- Use ATR based trailing stops (1.5× ATR is a standard starting point) once the trade is 1R or more in profit
- Scale in only if price holds above the breakout level with steady or rising volume. Avoid adding to losers
Low volume breakouts deserve extra caution because they often fade back into the prior range within a few sessions. If you take one anyway, tighten your stop and reduce position size by half.
Tools and Scanners to Find Volume Surge Breakout Stocks
Finding breakout candidates manually is slow and misses most opportunities. Scanners automate the hunt by filtering thousands of tickers against your volume and price criteria in real time. Look for platforms that let you set thresholds like volume at least 50 percent above the 20 day average, or 1.5 to 2 times the average for swing setups, and 3 to 5 times for intraday plays. Persistence matters too. Some scanners track whether elevated volume continues across multiple bars rather than spiking once and disappearing.
The best tools layer price action, volume, and indicator filters together. Volume moving average overlays show you when current volume is running hot or cold relative to history. The Volume Oscillator compares short term and long term volume averages. When it crosses above zero during a breakout, short term participation is accelerating. OBV, VWAP, and CMF are standard filters in most advanced scanners. VWAP is especially useful intraday because institutions use it as a benchmark. Breakouts above VWAP with volume often attract additional buying.
| Scanner | Useful Filters | Typical Use Case |
|---|---|---|
| Trade Ideas | Volume % change, price vs VWAP, OBV trend, ATR filters | Real time intraday scanning for gap and go and first hour breakouts |
| TradingView | Custom volume MA alerts, RSI/MACD cross, price above resistance | Swing scanning and alert setup for multi day setups |
| Finviz | Relative volume ≥1.5, price change %, technical patterns (wedge, flag) | End of day screening for consolidation breakouts and overnight scans |
| TC2000 | Volume buzz, EasyScan conditions, price crossing moving averages | Pre market screening and historical backtesting of volume rules |
Breakout Case Studies Using Volume Surge Signals

A technology stock consolidated for two weeks near $100 resistance, volume averaging 8 million shares daily. On the breakout day, volume spiked to 28 million (250 percent of the average) and price closed at $103.50. Over the next ten sessions the stock rallied to $121, a 20 percent gain from the breakout level. The key signal wasn’t just the volume number but the alignment. Volume surged on the exact candle that cleared $100, OBV had been rising for five days prior, and CMF stayed above +0.25 throughout the move.
An industrial name sat in a tight range between $48 and $52 for three months. Daily volume hovered around 2 million shares. When it finally broke $52, volume jumped to 4.5 million, 127 percent above the 20 day average. The stock added 9 percent in the following week and held above $52 on every retest. Traders who waited for the close above $52 and confirmed the volume increase had a clean entry with a stop at $51.80. Intraday, a biotech cleared its first 60 minute high of $34.20 with volume running at 5 times the prior 15 minute average. That 3 to 5 times multiplier signaled institutional flow, and the stock reached $36.80 by lunch.
Key lessons from these case studies:
- Volume surges carry more weight when they appear after quiet consolidation rather than during chaotic swings
- The breakout candle must close beyond the key level. Mid bar volume spikes without closes often reverse
- Multi indicator alignment (OBV rising, CMF positive, RSI trending) separates high probability setups from noise
Psychology Behind Trading Volume Surge Breakout Stocks

Breakout trading punishes hesitation and rewards discipline, but the gap between knowing the rules and executing them is psychological. When volume spikes and price rips through resistance, fear of missing out pushes traders to chase entries after the move’s already 4 or 5 percent extended. That decision flips a high probability setup into a coin toss because the risk reward is now inverted. Stops are wide, profit potential is reduced, and any pullback triggers an immediate loss. On the other hand, waiting too long creates analysis paralysis. By the time every indicator confirms, the best entry’s gone.
The traders who succeed with breakouts have practiced enough to trust their checklist and act fast when conditions align. They don’t second guess a clean setup, and they don’t invent reasons to take a marginal one. Common mistakes? Reacting to a single volume spike without context, entering before the breakout candle closes, and misinterpreting climax volume (a huge one day surge that marks exhaustion rather than the start of a trend). When you see volume spike to 400 percent on a vertical move, that’s often the end, not the beginning.
FOMO Management Techniques
Set entry alerts at breakout levels so the platform notifies you when price crosses, then take 15 seconds to verify volume and indicators before clicking. Use a hard rule: if you missed the initial breakout candle by more than one bar, skip the trade and wait for a retest or the next setup. Keep a trading journal that records whether you entered on the breakout candle or chased. Over time, the data will show that chasing delivers worse results and that fear costs money. Finally, build a large watchlist so you always have another opportunity coming. Scarcity thinking drives FOMO, abundance thinking calms it.
Building a Watchlist of Volume Surge Breakout Stocks
A strong watchlist is built before the market opens and maintained throughout the day. Start by scanning for stocks in consolidation. Tight ranges, flat moving averages, or bases forming near prior highs. Look for rising OBV even when price is flat, because that divergence signals accumulation. Program your scanner to flag tickers with volume at least 1.5 to 2 times the 20 day average, and add a secondary filter for price within 3 percent of a known resistance level. Premarket volume spikes and news catalysts (earnings, FDA approvals, analyst upgrades) often trigger intraday breakouts, so include those in your morning review.
Use these six criteria to classify candidates:
- Price consolidating near resistance for at least five sessions with stable or declining volume
- OBV trending upward while price moves sideways or slightly down
- Volume multiplier alert set at 1.5× for swing trades or 3× for intraday plays
- CMF reading positive (above zero) or improving over the past week
- Clear support or resistance level defined by at least three prior touches
- Catalyst on the calendar (earnings date, product launch, or sector rotation signal)
Review your watchlist every morning, remove names that have broken down or no longer meet the criteria, and add new tickers flagged by overnight scans. During the trading day, focus only on the 10 to 15 names that are closest to breakout levels so you’re not distracted when volume and price align. A clean, actively maintained watchlist is the difference between reacting to random noise and trading high probability setups with conviction.
Final Words
Scan for tickers showing 100% to 250% volume spikes that clear a clean resistance level. Those are your immediate watchlist candidates.
Keep it simple: volume should be at least 50% above the 20‑day average to validate, with the best setups 100–250 percent. Look for multi‑candle confirmation (three rising candles with volume climbing from about 120 to 180 percent) and confirm with OBV, CMF, RSI or MACD. Wait for a close above resistance and volume of 1.5x–2.0x before acting.
Manage risk: size for 1–2% of capital, use ATR‑based or just‑below‑breakout stops, and scan with 1.5x–3x filters. Use these rules and you’ll find cleaner, higher‑probability volume surge breakout stocks and trade them with more confidence.
FAQ
Q: What is the 3-5-7 rule in stocks?
A: The 3‑5‑7 rule in stocks is a trend‑confirmation guideline: require 3, 5, or 7 consecutive closes above resistance (shorter for intraday, longer for swing) before trusting a breakout.
Q: How to see volume breakout stocks?
A: Seeing volume breakout stocks means scanning for price clearing resistance on a candle close with volume at least 50% above the 20‑day average; stronger setups show 100%–250% spikes and rising follow‑through.
Q: What is the 90% rule in stocks?
A: The 90% rule in stocks is a conservative exit guideline: trim or close positions when you hit roughly 90% of your profit target to lock gains while leaving a small runner for upside.
Q: How to find 15 minute breakout stocks?
A: Finding 15‑minute breakout stocks means scanning 15‑minute charts for a candle close above resistance with a volume spike (often 3–5x intraday), confirmation by VWAP or rising OBV, then enter on pullback.