
Controversial take: clinical trial results matter more to biotech and pharma stocks than earnings or macro headlines.
A Phase 3 win can lift shares 20 to 100 percent in a day; a miss can wipe out 30 to 80 percent just as fast.
This post shows why trial outcomes drive those extreme moves, what to watch (phase, primary endpoint, safety signals, and competitive context), and a simple trading plan: where to enter, what confirms the setup, and the clear stop that makes you step aside.
How Trial Outcomes Move Biotech and Pharma Stocks

Clinical trial results move biotech stocks faster than almost anything else in the market. One headline about Phase 3 success can send shares up 20 percent before lunch. A missed endpoint? You’re looking at a selloff that wipes out weeks of gains by the close. These events are binary, and they reshape valuations overnight because the market is pricing in approval probability, launch timelines, and future revenue all at once.
Look at what’s happened recently. Madrigal Pharmaceuticals jumped over 200 percent in 2023 on positive NASH data. Same year, Acelyrin dropped more than 50 percent after disappointing Phase 2 results. Biogen climbed after successful Alzheimer’s readouts, validating years of spending and lighting a fire under the whole neurodegenerative space. Every case proves the same point: clinical trial results deliver extreme moves. They reward conviction and punish hesitation in equal measure.
If you’re watching biotech or pharma stocks, you need to understand how these swings work. Market reaction depends on trial phase, disease indication, enrollment size, endpoint clarity, safety signals, and competitive positioning. Shares can gap at the open, drift on profit taking, or crash on a single safety concern buried in a press release. Five reactions show up over and over:
- Strong positive efficacy meets statistical significance. Shares gap higher, sometimes 30 to 100 percent for small caps, and hold most of those gains intraday.
- Marginal efficacy or messy secondary endpoints. Price pops initially, then fades as people dig into the details.
- Safety flag or unexpected adverse event. Immediate sharp decline, often 30 to 60 percent for single asset companies.
- Trial meets primary endpoint but competition looks stronger. Modest gain or flat to down move as investors weigh commercial viability.
- Complete trial failure or futility stop. Catastrophic drop, frequently 50 to 80 percent or more for highly binary stocks.
Stock Behavior by Clinical Trial Phase

Phase 1 results don’t usually produce big moves unless something goes wrong. These early trials focus on safety and dosing in small groups, often 20 to 100 participants. Investors watch for severe adverse events and dose limiting toxicities. When Phase 1 clears without problems, shares might drift up a few percent. If serious safety issues show up, the stock can fall 10 to 30 percent because the program’s future is immediately in question. Few investors bet heavily on Phase 1 since efficacy isn’t evaluated in enough detail to support a strong case.
Phase 2 readouts hit stock prices harder because they offer the first real efficacy signals. Enrollment ranges from 50 to several hundred patients, and endpoints test proof of concept in target populations. A positive Phase 2 readout can lift shares 15 to 50 percent as the probability of Phase 3 success rises. Negative or unclear results often trigger 20 to 40 percent drops because they cast doubt on the entire program. Biotech volatility peaks here. Investors will pay for promising data but they’ll exit fast when results disappoint.
Phase 3 is where things get most intense. Pivotal trials enroll hundreds to thousands of patients and deliver data meant to support regulatory approval. Positive outcomes frequently produce 20 to 60 percent rallies and can exceed 100 percent for small companies with single program pipelines. Negative results spark selloffs of 30 to 60 percent or more, especially when there’s no backup candidate. Commercial expectations, peak sales forecasts, and competitive dynamics all reset in a single morning.
| Phase | Usual Market Impact | Typical Volatility |
|---|---|---|
| Phase 1 | Safety driven; minimal unless adverse events appear | ±5–30% |
| Phase 2 | Efficacy proof of concept; strong signal moves shares | ±10–50% |
| Phase 3 | Pivotal data; determines approval odds and commercial outlook | ±20–100% |
Historical Volatility Patterns in Clinical Trial Stocks

Clinical catalyst events rank among the most predictable sources of extreme price swings in biotech. Historical data shows that 20 to 60 percent moves around pivotal readouts aren’t outliers. They’re the norm for single asset companies and mid cap specialists. When a stock carries high short interest or elevated call option open interest, moves can go well beyond historical ranges, creating short squeezes or rapid gamma driven rallies.
Volatility clusters around three windows: the days before the readout, the immediate hours after the press release, and the weeks following as analysts update models and institutions adjust positions. Implied volatility often spikes 30 to 70 percent in the week before a headline, then collapses intraday by 20 to 60 percent once the outcome is known. This IV crush punishes option holders who bet on direction without accounting for the volatility reset that erases premium even when the underlying stock moves the way they expected.
The patterns stick around because trial results are binary events with clearly defined timelines. Unlike earnings, where guidance and quarterly trends soften the blow, a Phase 3 miss offers no soft landing. The drug either works or it doesn’t, and the market reprices accordingly. Four repeat volatility drivers define the landscape:
- Enrollment size and trial design clarity. Larger, well designed trials reduce noise and make results easier to interpret, often producing cleaner, sharper moves.
- Interim analysis schedules. Unscheduled Data Monitoring Committee announcements can trigger outsized intraday volatility.
- Safety history in the therapeutic class. Programs in areas with prior adverse events face amplified downside risk.
- Competitive context. Readouts that arrive after a competitor’s success or failure inherit adjusted expectations and compressed upside.
Major Upcoming Clinical Readouts Investors Watch
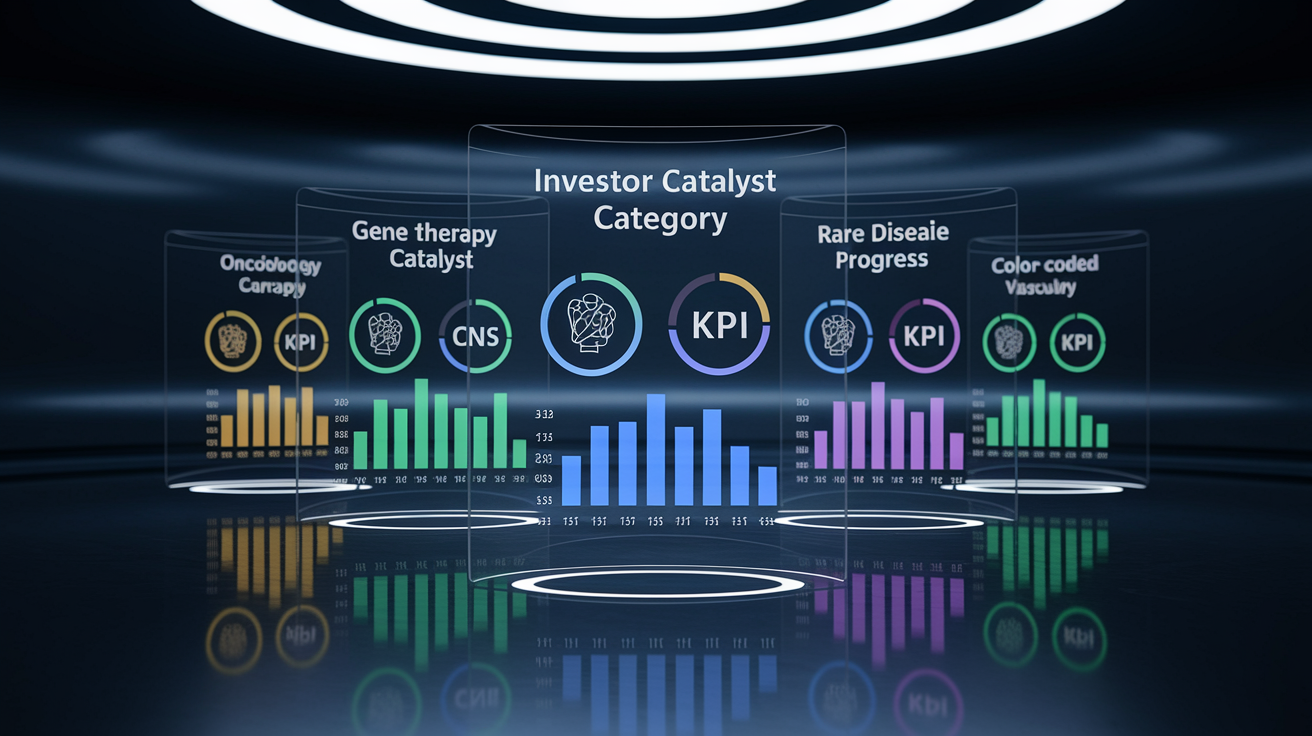
Upcoming biotech catalysts span multiple therapeutic areas, each carrying distinct market implications. Oncology Phase 3 trials command the most attention because cancer drugs represent the largest commercial opportunity and attract sustained institutional interest. Gene therapy readouts draw intense focus due to their transformative potential and regulatory complexity. CNS drug studies, particularly in Alzheimer’s and other neurodegenerative diseases, generate sector wide moves when pivotal data arrive.
Investors also track rare disease programs, where smaller patient populations allow accelerated regulatory pathways and premium pricing if approval is secured. Cardiovascular outcomes trials with event driven designs can run for years, making interim analyses critical inflection points. Infectious disease programs, including next generation vaccines and antiviral candidates, gained renewed importance after pandemic driven volatility demonstrated how quickly regulatory and commercial landscapes can shift.
Sector ETFs often move in sympathy with major readouts, especially when the announcing company holds significant index weight or when the trial tests a novel mechanism that could influence multiple programs. Watching these catalysts requires monitoring trial registries, sponsor press release schedules, and conference presentation calendars. Five common catalyst types dominate investor watchlists:
- Pivotal Phase 3 oncology readouts in large indications. Lung cancer, breast cancer, and hematologic malignancies with multi billion dollar revenue potential.
- Gene therapy interim analyses and durability data. Long term follow up required to confirm sustained efficacy and acceptable safety.
- CNS efficacy trials in Alzheimer’s, Parkinson’s, and depression. High profile, high risk programs with transformational upside if successful.
- Rare disease accelerated approval studies. Smaller trials that can unlock fast regulatory paths and orphan drug pricing.
- Event driven cardiovascular outcomes trials. Large enrollments and long durations make interim looks major market events.
Investor Strategies for Trading Clinical Trial Events

Biotech investment strategies around clinical data vary by risk tolerance and conviction level. Some traders accumulate shares weeks before a readout, betting on a pre data run up driven by rising optimism and short covering. Others wait until the press release hits, accepting slippage but avoiding the risk of holding through a negative headline. Neither approach guarantees success, but both rely on disciplined position sizing to survive inevitable losses.
Event driven trading often involves options to limit downside while preserving upside optionality. Buying call spreads or put spreads reduces capital at risk and caps maximum loss, though profit potential shrinks compared to outright equity positions. Traders must account for IV crush. A successful trial outcome can still result in option losses if implied volatility collapses faster than the stock rises.
Conservative investors hedge equity positions with protective puts or collar structures, accepting a lower ceiling in exchange for defined risk floors. Active managers sometimes short stocks when market implied probability of success appears wildly optimistic, though borrow costs and gap risk make shorting biotech catalysts dangerous. Position sizing remains the single most critical control. Limiting exposure to 1 to 5 percent of portfolio value per binary event prevents one bad readout from derailing overall returns. Five typical trading approaches appear repeatedly:
- Pre readout accumulation with tight stops. Buy shares two to six weeks before data, set a stop 15 to 25 percent below entry, exit on headline or IV collapse.
- Option straddles or strangles. Buy both calls and puts to profit from large moves in either direction, mindful of IV crush reducing net gains.
- Debit spreads to cap risk. Buy a near the money call and sell a higher strike call, limiting maximum profit but also capping maximum loss.
- Sector rotation into quality names. Shift capital from high risk single readout bets into diversified pharma with multiple catalysts and revenue streams.
- Post readout mean reversion trades. Fade extreme moves over two to eight weeks as initial reactions settle and fundamentals are reassessed.
Tools and Data Sources for Tracking Clinical Trials

Clinical trial calendar maintenance starts with ClinicalTrials.gov, the primary registry for U.S. and international studies. Investors search by sponsor, drug name, or indication, filtering for Phase 2 and Phase 3 trials with estimated primary completion dates in the coming quarters. SEC filings, particularly 8-K press releases and quarterly 10-Q risk factor updates, provide timelines and management commentary on trial progress.
Earnings calls and investor presentations reveal updated milestones, interim analysis schedules, and enrollment cadence. Conference presentations at major medical meetings often include preliminary data or investigator led analyses that can move shares even before official press releases. Catalyst tracking platforms aggregate these sources, offering sortable lists of upcoming readouts, FDA decision dates, and advisory committee meetings. Five essential data sources form the foundation:
- ClinicalTrials.gov. Protocol details, enrollment status, primary completion dates, and contact information for ongoing studies.
- FDA calendars. Advisory committee meeting schedules, PDUFA action dates, and breakthrough therapy designations.
- Sponsor press releases and SEC filings. Official announcements, risk updates, and forward guidance on trial timelines.
- Biotech event calendars and news aggregators. Specialized platforms that compile readout dates, conference schedules, and data presentation windows.
- Options scanners and implied volatility monitors. Real time tracking of IV rank, open interest, and volume spikes that signal market anticipation of upcoming catalysts.
Final Words
Trial readouts move prices fast. We covered how outcomes drive immediate moves, phase-specific behavior, historical volatility, upcoming catalysts, trading strategies, and the tools to track them.
Actionable steps: know the catalyst date, mark key levels, size positions, consider hedges, and set a clear invalidation level.
If you keep it simple, with clear entries, stops, and a timeline, clinical trial results stocks become tradable events, not guesswork. There are real opportunities when you manage risk.
FAQ
Q: Which biotech stock could rocket 800%?
A: The biotech stock that could rocket 800% would be a small-cap with a near-term pivotal readout showing clear efficacy. These cases are rare and very risky. Watch Phase 3, cash runway, and size positions small.
Q: What are the top 5 biotech stocks to buy?
A: The top 5 biotech stocks to buy depend on your goals and risk tolerance. Prioritize late-stage catalysts, strong balance sheets, clear mechanisms, reasonable valuation, and a nearby catalyst. Add those to a watchlist.
Q: Why are pharma stocks falling?
A: Pharma stocks are falling because of trial disappointments, weaker guidance, drug-pricing pressure, regulatory uncertainty, or broader market selloffs. Watch earnings, upcoming readouts, and patent timelines to decide whether to buy or step back.
Q: Are the results of clinical trials public?
A: The results of clinical trials are often public via ClinicalTrials.gov, peer-reviewed journals, and company press releases, though detailed datasets can be delayed or limited. Check registries and SEC filings for official data.