

Remember when tech darlings trading at 50-times earnings were “can’t miss” ideas? SMCI’s sitting at a 13 P/E near its 52-week low, and the market’s still walking away. That disconnect tells you everything about where confidence stands right now. This breakdown covers SMCI’s current technical position, recent financial whiplash (revenue up 152 percent quarter-over-quarter, EPS down 12 percent year-over-year), and the specific levels that matter if you’re watching for a turnaround or protecting against another leg down.
Super Micro Computer, Inc. (SMCI) — Price Snapshot and Technical Position

Super Micro Computer, Inc. trades on NASDAQ under the ticker SMCI. Last scrape showed shares down $0.36, a 1.13% drop from the previous close. Stock opened $0.15 higher than it closed, showing a little early strength before giving it all back.
SMCI’s currently trading near the bottom of its 52-week range and sitting below its 200-day simple moving average. Both signals point to a stock under pressure. When something’s trading near its annual low and can’t reclaim its long-term moving average, the market’s waiting for a real catalyst before stepping back in.
The large-cap classification puts SMCI between $10 billion and $200 billion in market cap. That size usually brings institutional attention and options liquidity, but it also means the stock needs meaningful news to move. A few percent swing on light volume won’t change anything. Watch for a clear break above the 200-day SMA with rising volume. That’s the first sign buyers are back in control.
Real-Time Trading Notes (Price Change, Open, Intraday Position vs. Ranges and Moving Averages)

The $0.36 decline and 1.13% drop tell you the stock gave back early gains and closed near the lows. That intraday reversal is a red flag for short-term traders. If shares can’t hold the opening pop, sellers are using any strength to exit.
Opening $0.15 above the prior close suggested overnight optimism, but that bid faded fast. When a stock opens higher then drifts lower all day, it’s often distribution. Larger holders quietly selling into demand. Pay attention to whether the next session opens below the previous day’s low. If it does, the selling’s probably accelerating.
Position relative to the 52-week range is critical. Trading near the bottom means SMCI has little cushion before testing new lows. Break below the 52-week low on heavy volume? Expect another leg down. Bounce off that level with a volume spike could signal a short-term reversal attempt.
The 200-day simple moving average acts as a long-term trend filter. SMCI’s below it, which means the dominant trend over the past year is down. Don’t fight that until the stock reclaims the average and holds for at least a few sessions. A one-day spike above doesn’t count. You need confirmation. Wait for the stock to close above the 200-day, pull back without breaking it, then resume higher. That’s a trend change.
Company Profile: Founding Date, HQ, Product Lines

Super Micro Computer was founded in September 1993 and is headquartered in San Jose, California. The company designs and manufactures x86-based energy-efficient rackmount and blade server systems. It sells primarily through distributors, value-added resellers (VARs), system integrators, and some OEMs.
Product lineup spans enterprise and data-center infrastructure. Key offerings include twin solutions, MP servers, GPU and coprocessor systems, MicroCloud, AMD solutions, power supplies, SuperServer, storage, motherboards, chassis, super workstations, accessories, SuperRack, and server management products. That breadth gives SMCI exposure to multiple end markets, from traditional data centers to high-performance computing and AI-driven workloads.
Founding in 1993 means the company’s survived multiple technology cycles. Dot-com boom and bust, the rise of cloud computing, and now the AI infrastructure buildout. Longevity suggests a durable business model, but it doesn’t guarantee future growth. Critical question for investors is whether SMCI can maintain its edge as hyperscalers and cloud providers increasingly design their own hardware or shift to direct partnerships with chipmakers.
San Jose headquarters puts SMCI in the heart of Silicon Valley, close to major tech customers and semiconductor suppliers. Geographic proximity matters because rapid prototyping, close customer collaboration, and fast turnaround times are competitive advantages. If you’re evaluating SMCI against peers, consider whether competitors have similar access to cutting-edge chips and design talent.
Key Stock Statistics (Market-Cap Classification, P/E, Dividend, 52-Week Context) — Indicate Missing Fields

SMCI’s classified as a large-cap stock, meaning its market cap falls between $10 billion and $200 billion. One article cited a P/E multiple of 13.53X, which is relatively modest for a company exposed to high-growth AI and data-center themes. A low P/E can signal either a value opportunity or skepticism about future earnings. Context from recent results and guidance will tell you which.
The exact current market cap, precise P/E ratio (trailing and forward), trading volume, and 1-day numeric range weren’t provided in the scrape. Those fields are critical for making informed trading decisions. Before acting on any setup, pull live data for current share price, exact market cap, P/E ratio, volume versus average volume, and the 1-day high/low range.
The 52-week range position (trading near the bottom) was noted, but the exact numeric low and high values are missing. You need those numbers to set alert levels and measure risk. If the stock’s at $X and the 52-week low is $X minus a small buffer, you know a break of that level will likely trigger technical selling and margin calls.
No dividend yield, ex-dividend date, or pay date was specified in the scrape. If SMCI doesn’t pay a dividend, that’s fine for a growth-oriented investor, but it removes one source of return and downside cushion. Companies that reinvest all free cash flow into growth often see higher volatility. Another reason to size positions carefully.
Next earnings date wasn’t included in the data. Earnings announcements are high-volatility events, especially for a stock trading near 52-week lows. If you’re holding into a report, know your risk and have a plan. If you’re waiting to enter, consider whether it’s smarter to buy after the numbers and guidance are out, even if you pay a slightly higher price for clarity.
Analyst ratings, price targets, and the distribution of buy/hold/sell recommendations were flagged as present on the page but lacked specific figures in the scrape. Analyst data helps gauge Wall Street’s consensus view and identify recent changes in sentiment. A cluster of downgrades or target cuts is a red flag. A wave of upgrades and raised targets can be a catalyst.
Recent Financial Performance (YoY and QoQ Revenue, Net Income, EPS Changes with Percentages)

Total revenue jumped 46.59% year-over-year and surged 152.75% quarter-over-quarter. That sequential acceleration is eye-catching. A 152% quarter-over-quarter gain suggests either a major new product ramp, a large contract, or a backlog clearing after supply constraints. Dig into the earnings call transcript to confirm which driver is real and whether it’s sustainable.
Net income told a different story. It fell 9.01% year-over-year but rebounded 138.03% quarter-over-quarter. The year-over-year decline means profitability lagged revenue growth over the past four quarters. That happens when a company invests heavily in capacity, ramps new products with lower initial margins, or faces cost inflation. The sharp sequential rebound in net income suggests those headwinds eased last quarter.
Earnings per share (EPS) dropped 12.92% year-over-year but climbed 135.27% quarter-over-quarter. The YoY decline is worse than the net income drop, which implies share dilution. Either from stock-based comp, a secondary offering, or convertible debt. Check the share count trend in the filings. If dilution’s ongoing and management isn’t buying back stock, future EPS growth will require even stronger profit gains.
The 135% QoQ EPS jump is the headline number bulls will point to. It shows the business can generate leverage when revenue scales. But one quarter doesn’t make a trend. Look at the next quarter’s guidance. If management forecasts sequential revenue and EPS growth, the story holds. If guidance is flat or down, the big Q-o-Q beat might have been timing or one-time in nature.
Revenue growth of 152% quarter-over-quarter paired with 138% net income growth means incremental margins were strong but not exceptional. Ideally, when revenue more than doubles, profit should more than double by an even wider margin due to operating leverage. Net income didn’t quite keep pace, which suggests either higher variable costs or increased operating expenses. Watch gross margin and operating margin trends in the next report.
Year-over-year comparisons matter more than quarter-over-quarter for long-term investors. The 46.59% YoY revenue gain is solid, but the 9% YoY net income decline and 12.92% YoY EPS drop are concerns. If the company’s growing the top line but shrinking the bottom line, it’s either in investment mode or facing structural margin pressure. Next few quarters will show whether this is a temporary dip or a new normal.
Technical Indicators Called Out on Page (200-Day SMA, 52-Week Range Position)

The 200-day simple moving average is a bright-line trend indicator. SMCI’s trading below it, which means the stock’s in a technical downtrend over the trailing year. Don’t try to call a bottom until the price closes above that average and holds for at least two sessions. Single-day spike above doesn’t count. It’s often a head fake.
When a stock’s below its 200-day SMA and near the bottom of its 52-week range, you’re looking at a name that’s been in steady retreat. The combination of these two signals tells you the market has lost confidence. That doesn’t mean the stock can’t rally, but it does mean any bounce will face overhead resistance at the 200-day line and at prior support levels that became resistance.
Use the 200-day SMA as a dynamic stop or entry filter. If you’re long and the stock breaks below the average on rising volume, it’s a signal to tighten stops or exit. If you’re waiting to buy, wait for a clear reclaim of the 200-day before adding size. Simple rule: don’t argue with a stock trading under its 200-day SMA unless you have a concrete catalyst and a tight risk plan.
The 52-week range position tells you how much downside cushion remains. If SMCI’s sitting just above the 52-week low, a small miss on earnings or a sector rotation can push it to new lows. New lows often trigger technical selling. Stop-loss orders, margin calls, and algorithmic breakdowns. That cascade can create a short-term capitulation low, which can be a buying opportunity for patient investors with strong conviction.
Conversely, a move from the bottom of the 52-week range toward the middle or top can generate momentum. As the stock climbs, short sellers cover, sidelined buyers chase, and technical breakout scans flag the name. That’s how a turnaround gains traction. The key is confirmation. Watch for a break above recent swing highs on volume before assuming the trend has flipped.
Combine the two indicators: if SMCI reclaims its 200-day SMA and simultaneously moves above the 25th percentile of its 52-week range, you have a two-part confirmation of trend change. Until both happen, treat rallies as counter-trend bounces and manage risk accordingly.
Sector and Competitors (Electronic Technology; Computer Processing Hardware)
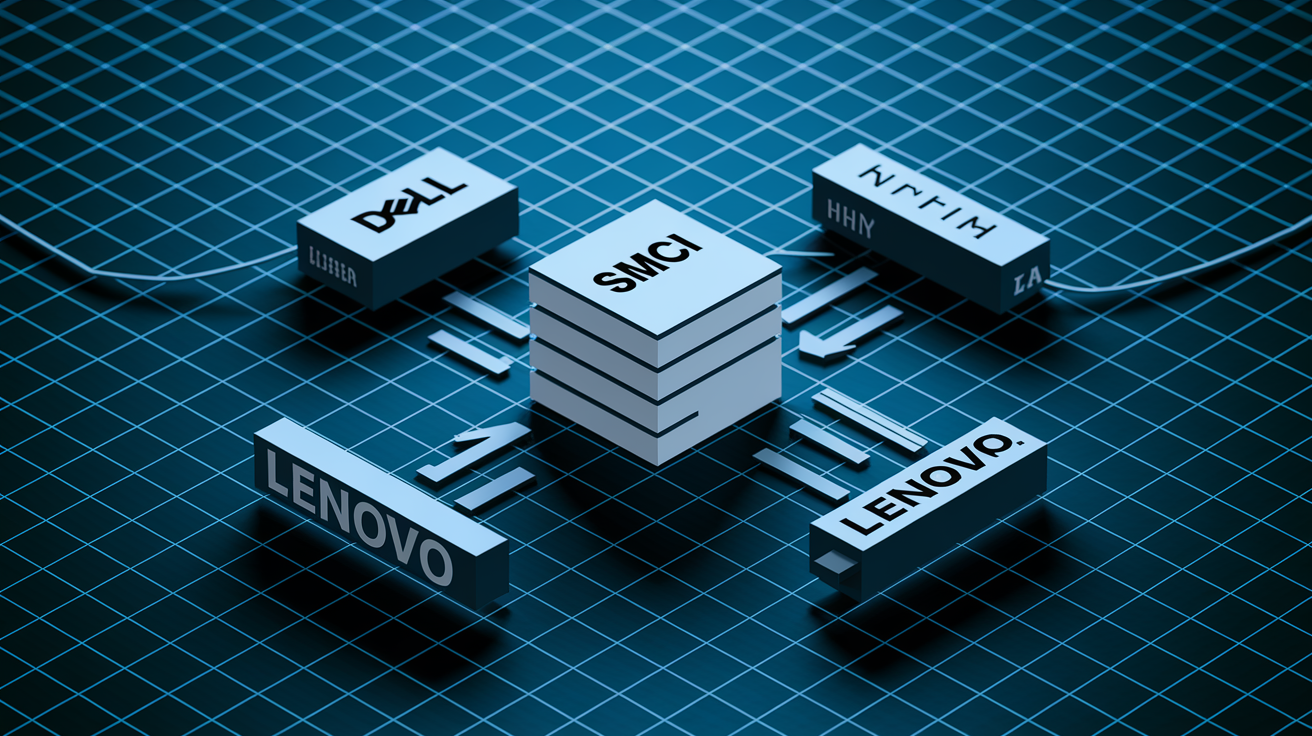
SMCI operates in the Electronic Technology sector, specifically the Computer Processing Hardware group. That classification puts it in direct competition with traditional server OEMs, white-box builders, and increasingly, hyperscale cloud providers that design their own infrastructure.
The Computer Processing Hardware group is cyclical and capital-intensive. Demand swings with enterprise IT budgets, data-center buildouts, and technology refresh cycles. When cloud providers and enterprises are expanding capacity (especially for AI, machine learning, or high-performance computing), SMCI and its peers see strong orders. When macro conditions weaken or customers digest prior purchases, orders dry up fast.
Competitors in this space include Dell Technologies, Hewlett Packard Enterprise (HPE), Lenovo, and to some extent, vertical integrators like NVIDIA (which partners with hardware builders but also influences design). Each competitor has different strengths: Dell has enterprise reach and services, HPE has hybrid-cloud and edge portfolios, Lenovo has scale and cost advantages, NVIDIA has chip-level influence and design partnerships.
SMCI’s competitive edge has traditionally been customization speed, energy efficiency, and close relationships with early adopters of new CPU and GPU platforms. The company often launches systems with the latest Intel, AMD, or NVIDIA chips ahead of larger, slower-moving OEMs. That time-to-market advantage matters in fast-moving segments like AI inference and training, where customers want cutting-edge silicon as soon as it’s available.
The risk is commoditization. As server designs become more standardized and hyperscalers build their own hardware or work directly with chip vendors, the value of a traditional server OEM shrinks. SMCI needs to prove it can add value beyond assembly (through software integration, thermal management, power efficiency, or service and support) to maintain pricing power and margins.
Sector rotation can impact SMCI independent of company fundamentals. If investors rotate out of hardware and into software or semiconductors, SMCI’s stock can fall even on good news. Conversely, a rotation into hardware (driven by a new data-center spending cycle or AI infrastructure wave) can lift the whole group, including SMCI. Watch sector ETFs and peer stocks for clues about broader sentiment.
Analyst/Forecast Sections Present but No Numeric Ratings/Priorities Provided in Scrape

The scrape confirmed that analyst and forecast sections exist on the page, but no specific numeric ratings, buy/hold/sell counts, or price targets were extracted. That’s a gap you need to fill with live data before making any trade decision.
Analyst ratings matter because they aggregate Wall Street’s view and can move the stock when changed. A cluster of upgrades (especially from top-tier firms) often precedes a rally. A wave of downgrades can accelerate a decline. The distribution of ratings (how many buys vs. holds vs. sells) tells you whether the Street is bullish, neutral, or bearish.
Price targets give you a sense of expected upside or downside. If the median target’s 20% above the current price and most analysts rate the stock a buy, that’s a tailwind. If the median target’s below the current price or analysts are cutting targets, it’s a headwind. Always check the date of the most recent target change. Stale targets from six months ago are less useful than fresh updates from the past few weeks.
Forecast sections typically include next-quarter and full-year EPS and revenue estimates. Those consensus numbers set the bar for earnings beats or misses. If SMCI reports above consensus, the stock often rallies. Below, and it usually sells off. The magnitude of the surprise matters. A 2% beat is nice, a 10% beat is a catalyst.
Look for trends in estimate revisions. If analysts have been raising estimates over the past month, it signals improving confidence. If they’ve been cutting, it signals caution. Estimate revision momentum is a leading indicator. It often changes before the stock price does.
Without the numeric data, you’re flying blind. Before entering or adding to a position, pull the latest analyst summary from your broker or a financial data provider. Focus on the consensus rating, median price target, estimate trend, and any recent upgrades or downgrades with explanations.
Data Sources and Timing Notes (Quote Provider, Time Zone)

Most stock quote data on the page was indicated as provided by BATS, with market times shown in Eastern Time (ET). BATS is a major U.S. equities exchange and a common source for real-time and delayed quotes. If the data’s delayed by 15 minutes, make sure you’re aware of the lag before acting on a price move.
Time zone consistency is critical when tracking intraday price action or news releases. All times in this article and on the source page are in ET unless otherwise noted. If you’re trading from another time zone, convert carefully to avoid confusion. Missing a market open or a key announcement by an hour because of a time-zone error is an expensive mistake.
Data staleness is a risk, especially if the scrape or page hasn’t been refreshed recently. Always check the timestamp on the quote. If it says “as of [date] [time],” compare that to the current time. If the quote’s hours or days old, refresh or pull live data. Stale data can lead to bad entries, missed exits, or false confidence in a price level that no longer exists.
The copyright notice dated 2026 and the “as is” disclaimer mean the data provider offers no guarantee of accuracy or completeness. That’s standard in the industry, but it’s a reminder to verify critical numbers, especially before placing a large trade. Cross-check price, volume, and key metrics against your broker’s live feed or a second source.
If you’re using the page for research, note that the quote provider (BATS) may not include all off-exchange trades or dark pool activity. Volume figures can be understated, and the last-sale price might not reflect the true market if large blocks trade privately. For liquid large-caps like SMCI, this is usually a minor issue, but it’s worth knowing.
Always timestamp your analysis. Markets move fast. A setup that looks good at 10 a.m. ET can be invalid by 2 p.m. if news breaks or the stock gaps through a key level. Write down the time you pulled data and the time you made your decision. If something feels off, refresh and re-check before committing capital.
Gaps to Populate with Live Data: Current Share Price, Exact Market Cap, P/E Ratio, Volume, 1-Day and 52-Week Numeric Ranges, Next Earnings Date, Dividend Yield, Analyst Ratings and Price Targets, Interactive Charts
The scrape didn’t provide a current share price in absolute terms. You need that number to calculate position size, set stop-loss levels, and assess risk-reward. Before taking any action, pull the live quote and note the exact price and timestamp.
Exact market cap is essential for comparing SMCI to peers and understanding liquidity. A $12 billion market cap trades differently than a $50 billion market cap, even within the same size bracket. Market cap also determines index inclusion, institutional ownership thresholds, and options liquidity.
The P/E ratio (both trailing twelve months and forward) tells you how the market’s valuing earnings. A trailing P/E of 13.53X was cited in one article, but you need the current figure and the forward P/E based on next year’s estimates. Compare those to sector peers and the stock’s own historical range. If SMCI typically trades at 20X and it’s now at 13X, either the market sees a problem or it’s a value opportunity.
Volume and average volume (three-month or ten-day) are critical for assessing liquidity and confirming price moves. A breakout on heavy volume is more reliable than a breakout on light volume. If today’s volume is double the average, something’s happening. Either news, a large institutional order, or a technical trigger. If volume’s below average, the move’s less meaningful.
The 1-day numeric range (intraday high and low) shows you the session’s volatility and where the stock closed relative to the range. A close near the high suggests buying pressure. A close near the low suggests distribution. The 52-week numeric range (exact low and high with dates) is your long-term context. Mark those levels on your chart and watch for tests and breaks.
Next earnings date is a key risk event. If earnings are two weeks away and you’re considering a new position, decide whether you want to hold through the report or exit beforehand. Holding through earnings can deliver outsized gains or losses. If you’re not comfortable with that binary risk, wait until after the numbers.
Dividend yield, ex-dividend date, and pay date matter if SMCI pays a dividend. If it doesn’t, note that and adjust your return expectations. Non-dividend payers often reinvest cash into growth, which can mean higher capital appreciation but also higher volatility.
Analyst ratings and price targets were flagged as missing specific numbers in the scrape. Get the consensus rating (buy/hold/sell counts), median and mean price target, high and low target, and the dates of recent changes. If three analysts raised targets in the past month, that’s a bullish signal. If two downgraded in the past week, that’s a red flag.
Interactive charts for multiple timeframes (1D, 5D, 1M, 6M, 1Y, 5Y) are essential for visual analysis. Look for support and resistance levels, moving-average crossovers, volume spikes, and pattern formations (flags, wedges, head-and-shoulders). Use intraday charts to time entries and exits. Use longer-term charts to confirm the trend.
Before acting on any of the analysis in this article, populate every missing field with live data. Write it down, timestamp it, and base your trade decision on current numbers, not placeholders or stale scrapes.
Recent Notable News (with Dates & Numeric Highlights): Feb. 19: $40B Revenue Outlook Cited as Catalyst for a Surge
On February 19, SMCI reportedly issued a $40 billion revenue outlook that reignited AI-related momentum and coincided with a surge in the stock. A revenue target that large is a major statement, especially for a company in the large-cap bracket. It signals management’s confidence in order backlog, customer demand, and the ability to scale production.
The $40 billion figure is the key number. Put it in context by comparing it to the company’s trailing-twelve-month revenue. If TTM revenue is, say, $10 billion, then $40 billion implies quadrupling over some time horizon, likely multiple years. Clarify the timeframe from the original announcement. Is this a one-year target, a three-year target, or a long-term aspiration? The timeline changes everything.
The market’s reaction (described as a surge) suggests investors took the guidance seriously. A stock doesn’t jump on vague aspirations. It jumps when the Street believes the numbers are achievable and not yet fully priced in. Check whether the surge held or reversed in the days following the announcement. If the stock gave back all the gains within a week, skepticism set in. If it held and built on the move, conviction’s stronger.
News-driven surges are often followed by consolidation or pullbacks as early buyers take profits and late chasers get shaken out. If you missed the initial pop, wait for a pullback to a logical support level. Prior resistance, a moving average, or a Fibonacci retracement. Chasing a vertical move rarely works.
The $40 billion outlook likely ties to AI infrastructure demand, hyperscale data-center expansion, or a combination of both. SMCI’s product lines (GPU systems, high-density servers, energy-efficient racks) are core to AI training and inference workloads. If the outlook assumes continued AI spend, monitor news from NVIDIA, AMD, cloud providers, and enterprise customers for confirmation or cracks.
Use the February 19 date as a marker. Compare the stock’s price and technical position on that day to today. If the stock’s now lower despite the bullish guidance, something changed. Either broader market conditions, competitive pressure, or doubt about execution. Dig into subsequent earnings calls, press releases, and analyst notes to find out what shifted.
Early February: Double-Digit Monthly Surge Referenced
Headlines referenced a double-digit percentage surge in SMCI shares during early February. The exact percentage and start/end dates weren’t provided, but “double-digit” means at least 10% and likely refers to a move over a few weeks or a single month.
A double-digit monthly gain is significant, especially for a large-cap stock. It suggests either a major catalyst (earnings beat, guidance raise, analyst upgrades) or a broader sector rally. Check whether the surge was SMCI-specific or part of a group move in hardware, AI infrastructure, or technology more broadly.
If the surge was isolated to SMCI, it’s more meaningful. It means the company did something. Released strong numbers, announced a partnership, or resolved an overhang. If it was part of a sector-wide rally, the move’s less about SMCI’s fundamentals and more about sentiment or rotation.
Surges on light volume or low conviction often reverse quickly. Check the volume trend during the surge. If volume was above average and rising, the move had institutional participation and staying power. If volume was average or below, it was retail or momentum-driven and more likely to fade.
Use the surge as a reference point for resistance. If the stock rallied hard in early February and has since pulled back, the high of that surge becomes overhead resistance. The stock will need to break back through that level on volume to resume the uptrend. Until it does, treat rallies as relief bounces within a larger consolidation or downtrend.
Ask yourself: what was the catalyst for the early February surge, and is it still valid? If it was anticipation of the $40 billion revenue outlook (announced later in the month), the move makes sense. If it was something else (a short squeeze, a sector rotation, or a false breakout), the durability of the gain is questionable.
Mention of a 6% Decline Over a One-Month Span in a Recent Article
A recent article referenced a 6% decline over a one-month span. That’s a meaningful pullback, especially if it followed the earlier double-digit surge. A 6% drop can erase weeks of gains and signal a shift from accumulation to distribution.
The one-month timeframe suggests the decline was gradual rather than a single-day crash. Steady, grinding losses are often more damaging to sentiment than sharp selloffs. A crash can create a washout and a bounce. A slow bleed just wears down holders and discourages new buyers.
Check the volume during the decline. If the stock fell on rising volume, it’s distribution. Large holders are exiting. If it fell on falling volume, it’s apathy or a lack of buyers rather than active selling. The former is more concerning because it implies informed money is leaving. The latter can reverse quickly if a catalyst appears.
Compare the 6% decline to the index and sector. If the S&P 500 was flat and SMCI fell 6%, that’s relative weakness and a red flag. If the market was down 8% and SMCI fell 6%, that’s relative strength and a potential buy signal on a bounce.
Use the decline to identify support levels. Where did the stock stabilize? If it bounced off a prior low, a moving average, or a round number, that’s your support. If it’s still falling with no clear floor, wait for a capitulation low (a high-volume down day followed by a reversal) before stepping in.
The 6% drop might also reflect profit-taking after the earlier surge or disappointment that the $40 billion revenue outlook didn’t translate into immediate upside. Markets often sell the news after buying the rumor. If that’s the case, the decline is healthy and sets up the next move higher once the dust settles.
MarketBeat Week in Review: 03/02–03/06
The MarketBeat week in review covering March 2 through March 6 was referenced in the scrape. That tells you SMCI was notable enough during that week to warrant inclusion in a summary of market activity. Check whether the mention was positive (strong performance, earnings beat, upgrade) or negative (decline, downgrade, warning).
A week-in-review mention often highlights either outsized volatility or a significant news event. If SMCI moved more than peers or the index that week, it’s worth digging into the specific days to understand what drove the action. Was there an earnings release, a product announcement, or a sector rotation?
Use the March 2–6 timeframe to anchor your chart analysis. Mark the week’s high, low, and close. Compare the week’s price action to volume and see if there were any unusual patterns. Gaps, reversals, or breakouts. If the week ended higher on strong volume, it’s a bullish setup. If it ended lower on heavy selling, it’s a bearish signal.
Week-in-review articles are often backward-looking and don’t provide forward guidance, but they do highlight what the market cared about in the moment. If SMCI was featured for a positive reason (like a strong bounce or a breakout), check whether the move continued in the following week. If it stalled or reversed, the initial excitement didn’t have legs.
If the review noted analyst activity (upgrades, downgrades, target changes), track down the specifics. Analyst moves during a notable week can be catalysts or responses to price action. An upgrade on a down week is contrarian and potentially bullish. A downgrade on an up week is a red flag.
Analyst Coverage Summary: Buy/Sell/Hold Stories, Upgrades/Downgrades, Price-Target Commentary
The scrape confirmed that analyst coverage, upgrades, downgrades, and price-target commentary were present on the page, but specific counts and numbers weren’t provided. This is critical information you need to source separately before trading.
Analyst coverage breadth matters. A stock covered by 15 analysts has more liquidity, more information flow, and more consensus data than a stock covered by three. SMCI, as a large-cap name in a high-profile sector, likely has solid coverage. Check how many firms publish research and whether top-tier banks (Goldman, Morgan Stanley, JPMorgan) are included.
The distribution of buy, hold, and sell ratings tells you the Street’s aggregate view. If 10 analysts rate it a buy, 3 a hold, and 1 a sell, sentiment is bullish. If the split is 3 buys, 8 holds, and 3 sells, sentiment is mixed to bearish. A skew toward hold ratings often means analysts are waiting for more data or see limited near-term upside.
Recent upgrades and downgrades are more important than the static rating distribution. If three analysts upgraded in the past month, that’s a momentum signal. If two downgraded last week, that’s a warning. Note the firm, the old rating, the new rating, the old price target, the new price target, and the stated reason. The “why” is often more valuable than the rating change itself.
Price-target changes can move the stock, especially if the new target is well above or below the current price and comes from a respected firm. If an analyst raises the target from $50 to $70 and the stock’s at $55, that’s a 27% implied upside and a potential catalyst for a rally. If an analyst cuts the target from $60 to $45 and the stock’s at $50, expect selling pressure.
Look for consensus estimate trends, not just point estimates. If the average EPS estimate for next quarter has been rising over the past four weeks, it means analysts are getting more confident. If estimates have been falling, it means caution or downgrades are underway. Estimate revision direction is a leading indicator of stock performance.
Analyst notes often include qualitative commentary about product cycles, competitive positioning, management execution, or macro headwinds. Read the summaries for themes. If multiple analysts cite the same risk (e.g., supply-chain constraints or customer concentration), it’s a real concern. If multiple analysts highlight the same opportunity (e.g., AI server demand or market-share gains), it’s worth investigating.
Before acting on this section’s guidance, pull the live analyst summary from your platform or a financial data service. You need the current consensus rating, the number of analysts in each category, the median and mean price target, the high and low target, and the dates and details of recent changes.
Earnings & Financials Section: Revenue Outlooks, Recent Earnings Reactions (Tie to $40B Headline)
The $40 billion revenue outlook is the centerpiece of the earnings and financials narrative. That figure, announced on February 19, sets the bar for future quarters and years. To evaluate its credibility, you need to know the time horizon. Is it a one-year goal, a three-year target, or a long-term aspiration?
Compare the $40 billion figure to SMCI’s trailing-twelve-month revenue. If TTM revenue is $10 billion, reaching $40 billion implies a 4x increase. That’s aggressive and would require sustained high growth, major market-share gains, or new product categories. If TTM revenue’s already $20 billion, doubling to $40 billion is more plausible but still requires strong execution.
Revenue outlooks are only valuable if they come with a plan. Check whether management detailed the drivers. New customer wins, product launches, capacity expansions, or partnerships. Vague aspirational targets are less credible than outlooks backed by firm orders, signed contracts, or disclosed backlog.
Recent earnings reactions are a window into how the market’s weighing the outlook against current results. If SMCI beat estimates and raised guidance, and the stock still sold off, it means the beat was priced in or guidance disappointed relative to hopes. If the stock rallied on in-line results but strong forward commentary, it means the market cares more about the future than the past.
Tie the $40 billion headline to quarterly revenue trends. Look at the past four to eight quarters of revenue. Is growth accelerating, decelerating, or lumpy? If Q1 revenue was up 20% YoY, Q2 up 35%, Q3 up 50%, and Q4 up 150%, the trend’s accelerating sharply and the $40 billion target looks more achievable. If growth is choppy or slowing, the target’s aspirational.
Margins matter as much as revenue. A company that hits $40 billion in revenue but earns razor-thin margins isn’t as valuable as one that hits $30 billion with strong margins. Check gross margin, operating margin, and net margin trends. If margins are expanding as revenue grows, it’s a sign of operating leverage and pricing power. If margins are contracting, it’s a sign of competition, cost inflation, or unfavorable mix.
Free cash flow is the ultimate validation of earnings quality. If SMCI’s growing revenue and earnings but burning cash, there’s a problem. Either working-capital intensity, heavy capex, or accounting noise. If free cash flow’s growing in line with or faster than earnings, the business is healthy and the outlook’s more credible.
Use the earnings release calendar to plan your trading around the next report. If earnings are two weeks away, decide whether you want to hold through the event or take chips off the table. If you’re waiting to enter, consider whether you’d rather buy before the report (for potential upside surprise) or after (for clarity and reduced risk).
Final Words
We jumped into the setup: earnings and guidance reshaped the outlook and price action picked a clear buy zone.
The takeaway: if revenue and margins hold, the stock can run; if they don’t, sellers will press lower.
What to watch next: smci stock into the next report, trendline support, and any guidance change. Scale in on confirmation, trim into strength, and keep stops tight.
If support breaks, step aside and reassess. This still looks like a tradable setup with upside.
FAQ
Q: Is SMCI a good buy right now?
A: SMCI is a good buy right now if you believe AI and data-center demand will sustain high growth; weigh its rich valuation, earnings volatility, and watch the next guidance before adding shares.
Q: What will SMCI stock be worth in 2030?
A: SMCI stock’s 2030 value can’t be known; project scenarios using revenue CAGR, margins, and a reasonable multiple, then update with product adoption, backlog, and quarterly guidance.
Q: What is the SMCI price target?
A: The SMCI price target is set by analysts and varies; check the latest consensus on broker reports or financial platforms and build your own target using forward P/E or EV/revenue versus peers.
Q: Did BlackRock buy SMCI stock?
A: BlackRock may own SMCI through ETFs or active funds; confirm by checking SEC 13F filings, BlackRock fund holdings pages, or major fund disclosures for current ownership details.
